Diesel
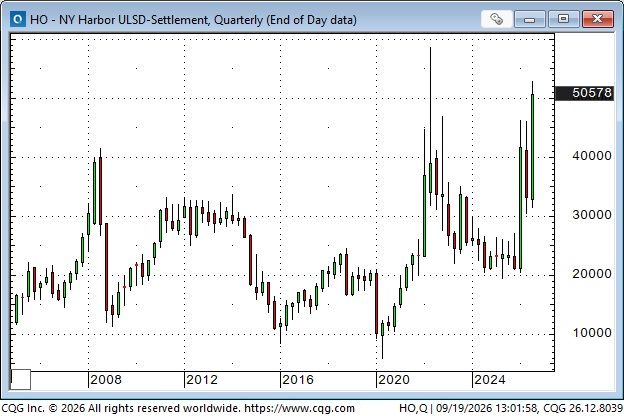
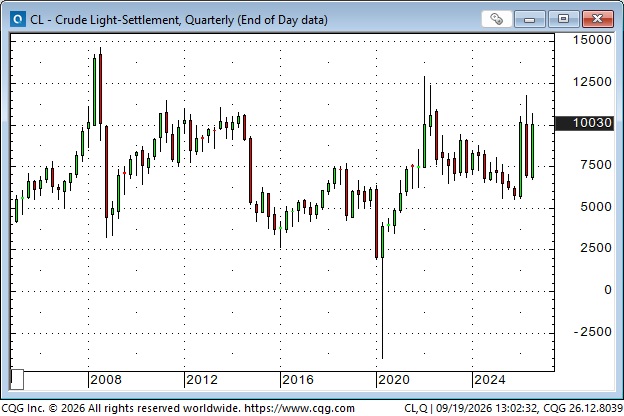
The US national average today for roadside diesel is ~$6.50, a record high, up about $1 from a month ago. A year ago, it was ~$3.75. California is now over $8. The two 20-year charts below of front-month NYMEX Ultra-Low-Sulphur Diesel and WTI crude oil show how diesel prices have recently outperformed crude oil. The global refining capacity shortage is greater than the crude oil shortage.
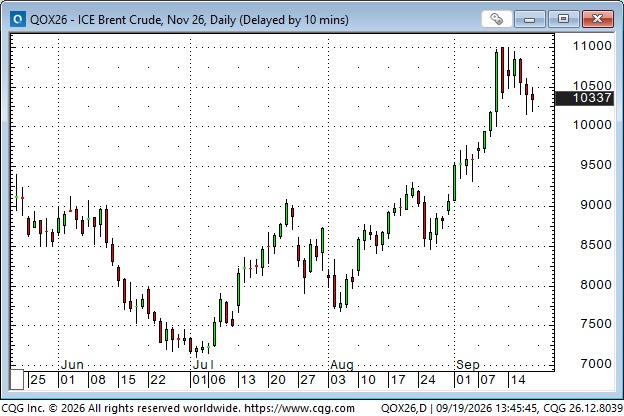
Front-month Brent crude oil futures rallied to 4-month highs of ~$110, up ~60% from the June lows, as attacks on three pumping stations on the Saudi East/West pipeline (and swift military advances by the Houthis along Yemen’s Red Sea border) reminded markets of the vulnerability of Middle Eastern crude oil export routes. After the attacks, the KSA notified European buyers that it would cancel some planned crude oil deliveries.
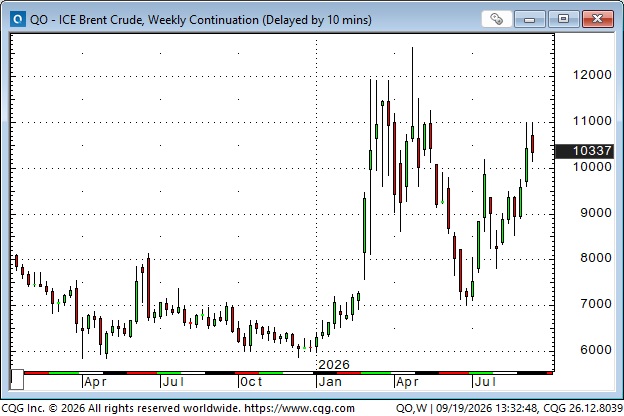
The rally in crude oil and refined products “came off the boil” this week on reports that the KSA had asked China to ask the Houthis to “cool it,” and on reports that more crude was flowing through Hormuz.
Natural Gas
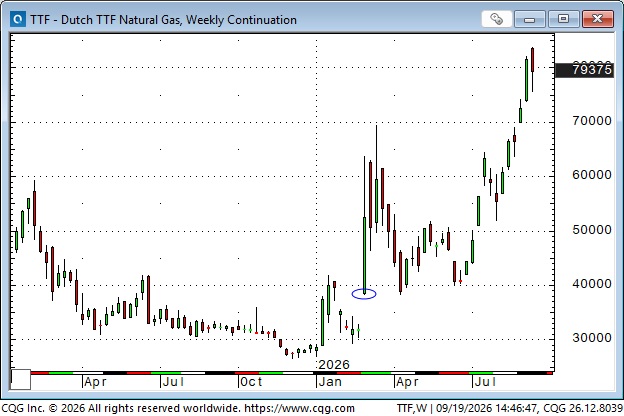
This chart of front-month Dutch TTF Natural Gas shows that prices spiked at the start of the war in Iran (blue ellipse), fell back in the April to June period, but have soared to new highs since July as LNG deliveries from Qatar have been a fraction of expectations, leaving net European storage dangerously under-supplied ahead of winter.
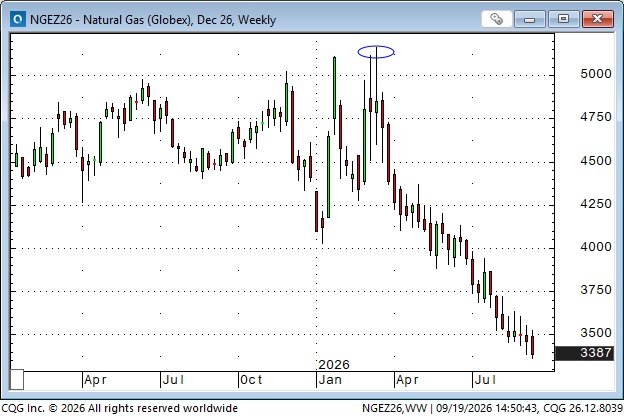
Ironically, as European natural gas prices have soared, the NYMEX December futures contract has been in a nose-dive since mid-March (blue ellipse) as North American natural gas production is at record highs. Open interest on NYMEX natural gas futures is at a record high (up ~20% since March). Large speculators hold the largest-ever net short position.
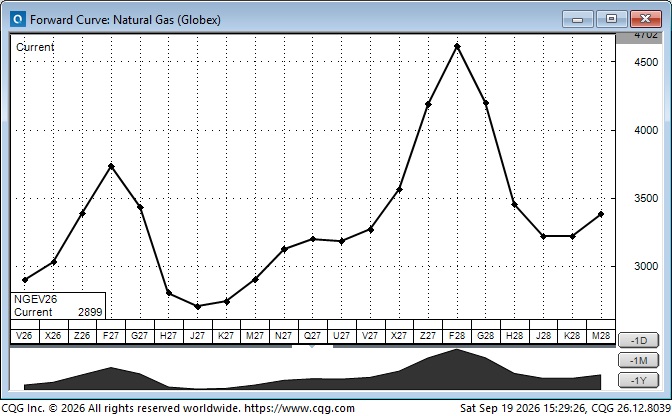
NYMEX natural gas futures have seasonal variance, with January prices usually the highest of the year, followed by lows in April/May. In this forward-curve chart, the first high at ~$3.73 is January 2027, and the second high at ~$4.60 is January 2028. I wonder if these seasonal highs and lows will be “flattened out” if/when data centers ramp up natural gas demand.
Bonds
The ~60% jump in crude prices over the past 12 weeks continues to impact all markets, especially bonds, where global yields have surged higher. Since the war with Iran began at the end of February (blue ellipse), yields on the US 10-year Treasury have risen from ~4% to ~5%, a 19-year high. The Canadian 10-year yield has risen from ~3.1% to ~3.9%, a 3-year high.
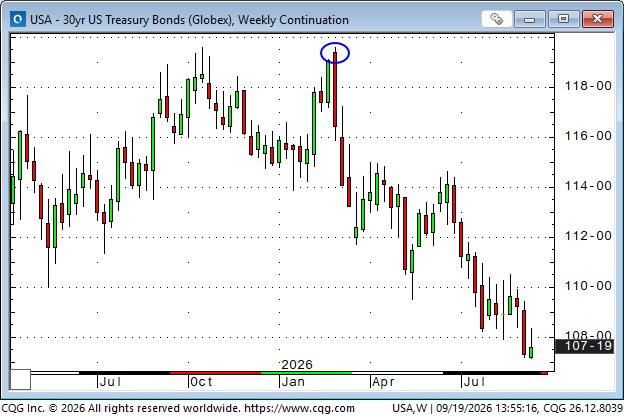
Bond yields are rising as higher energy prices are expected to increase inflation. Higher issuance from governments and corporations has also boosted yields.
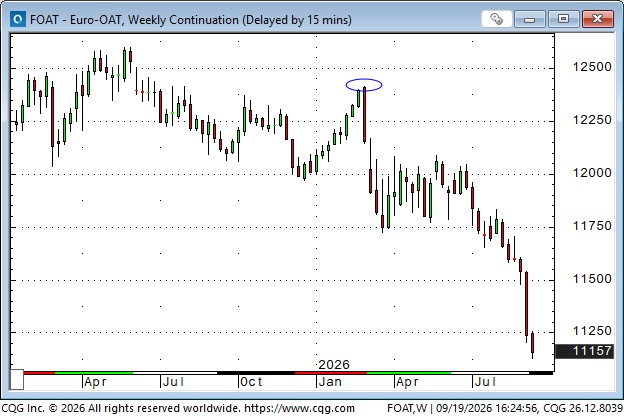
French bond prices dropped sharply after the start of the war in Iran (blue ellipse) and have fallen further over the past month, with yields reaching an 18-year high of ~4.58%.
Central banks
Central banks are expected to keep raising short rates. This chart from rateprobability.com shows markets pricing in leading central banks raising short rates by ~70 to ~115 bps over the next 12 months. (The white line shows the trajectory of expected rate increases from the Bank of Canada to total ~115 bps by August 2027.)
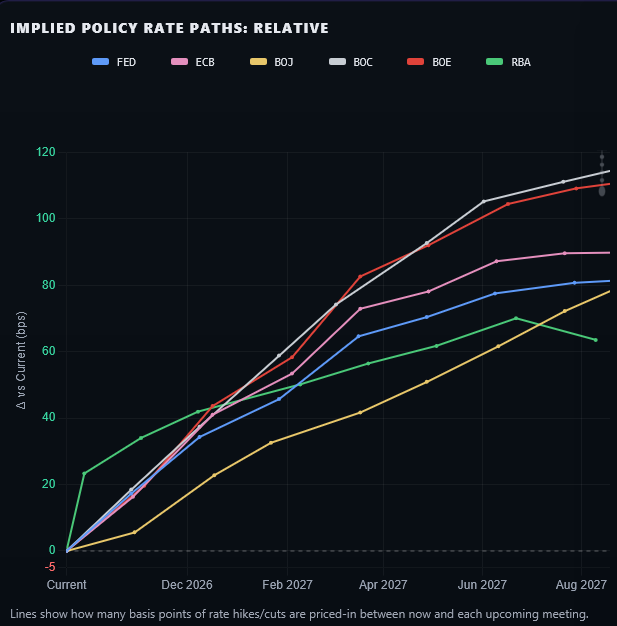
The FOMC raised rates by 25 bps on Wednesday, with Chairman Warsh saying that “Inflation is too high, and has been too high for too long.” The blue line on the chart above shows that the market expects at least one more 25 bps increase from the Fed this year.
The Bank of Japan raised rates by 25 bps (to a 31-year high) on Friday, as expected, and the yellow line on the chart above shows that the market expects another ~80 bps over the next 12 months.
The Bank of England left rates unchanged this week, but as the red line on the chart shows, the market is expecting over 100 bps from the BoE over the next 12 months.
Stocks
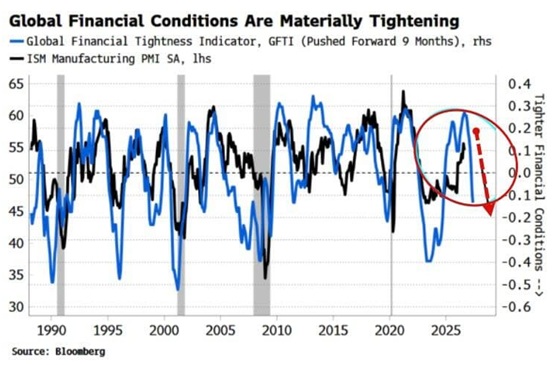
Higher interest rates, higher commodity prices and widening credit spreads are tightening global financial conditions, which may pressure share prices. Here’s a chart from Simon White, senior economist at Bloomberg.
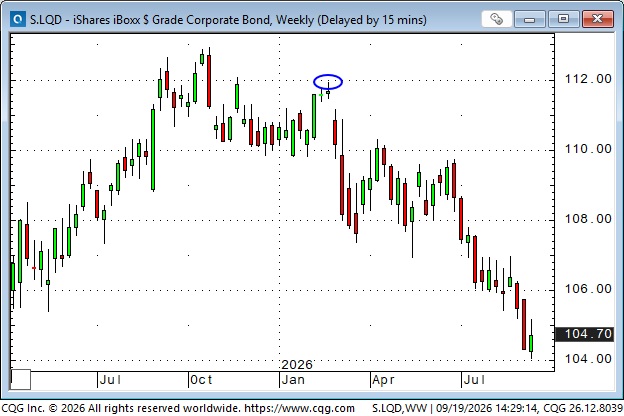
This chart of an Investment Grade Corporate Bond ETF shows that prices have been trending lower since the start of the war in Iran (blue ellipse). Massive debt issuance from AI firms (and some “concerns” about the future of AI) has widened credit spreads.
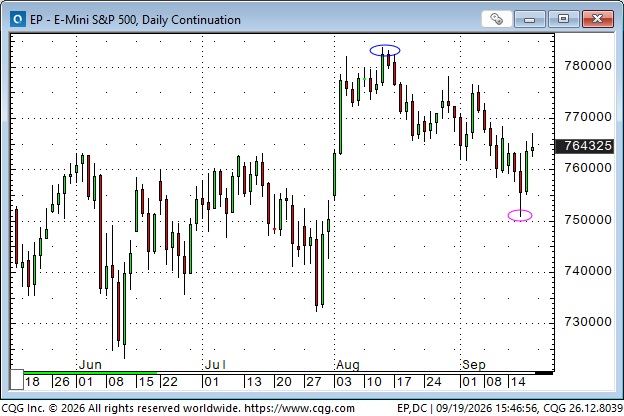
The S&P Index has drifted ~2% lower from the August record highs (blue ellipse). The war in Iran and higher energy prices are background worries, and mixed feelings about AI’s future persist. Mid-September to mid-October is seasonally the weakest period of the year for the US equity market, especially in midterm election years. The market made a 6-week low on Wednesday (pink ellipse) following the FOMC meeting, but rallied back ~150 points to Friday’s high.
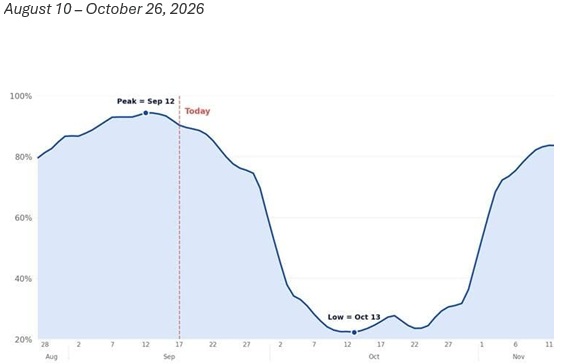
Corporate quarterly reports have just started, which means corporate buybacks will be significantly reduced over the next month or so (no buybacks are allowed beginning three weeks before report dates; they can resume after the quarterly report). Corporate buybacks are typically a significant source of buying (total authorizations for 2026 are estimated at over $1.4 trillion).
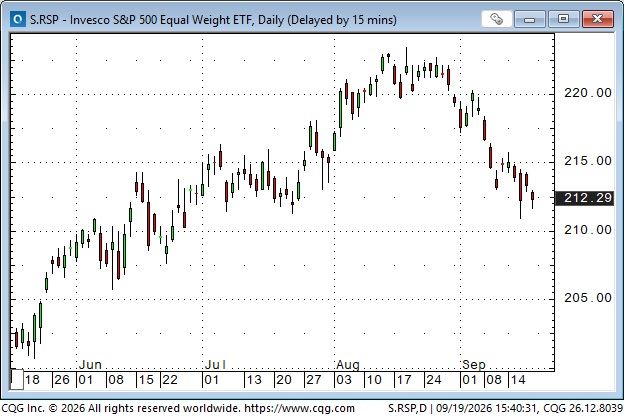
The equal-weight S&P ETF is down ~5.5% from its mid-August record highs.
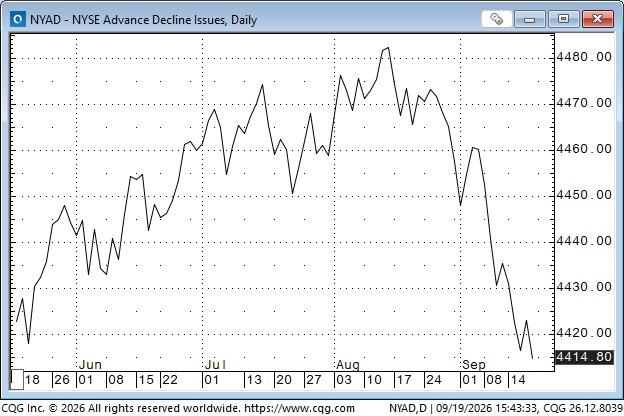
The NY Advance/decline has turned down from the record highs hit in August.
Systematic accounts are currently net long equities, but Wall Street analysts expect them to turn net sellers if the S&P drops below this past week’s low.
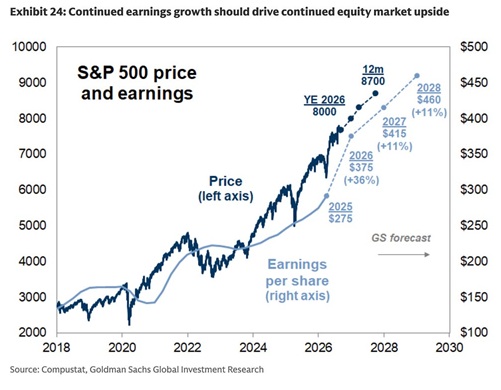
The S&P’s rise over the past few years has correlated with rising earnings. Goldman Sachs analysts expect that to continue.
Currencies
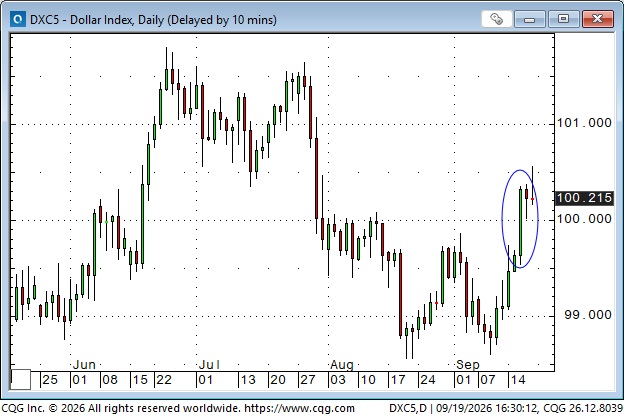
The DXY US Dollar Index has rallied ~2% over the last two weeks, with a leg higher on Wednesday (blue ellipse) following the FOMC rate increase.
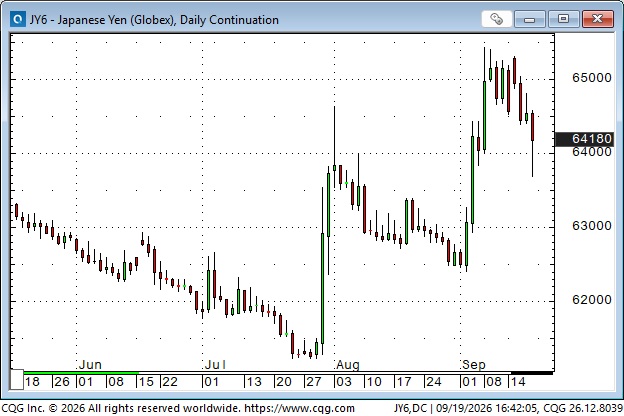
The Yen has fallen ~2% from the highs reached early last week, following the 5% rally in the first few days of September (traders believe that rally was not official intervention, but may have been sparked by “semi-official” buying from an account like the GIPF). COT data as of September 15 show that large speculators swung dramatically from net short the Yen to net long over the previous two weeks.
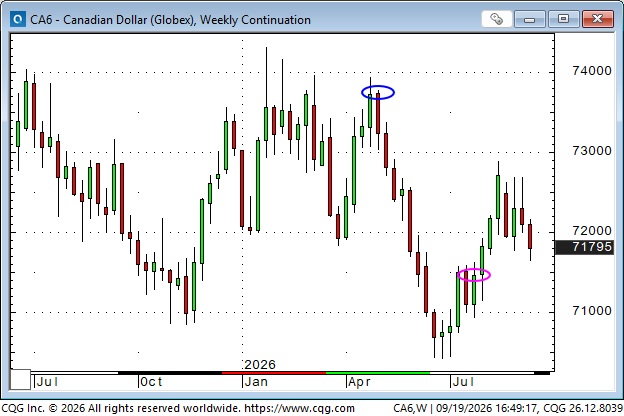
The Canadian Dollar has weakened modestly over the past two weeks as the USDX has rallied. Two-year interest rate differentials (USD – CAD) are now ~140 bps in favour of the USD. COT data shows that large speculators built a substantial net short position as the CAD fell from late April highs (blue ellipse) to the end of July (pink ellipse). Since the end of July, they have collapsed that net short position and are now effectively sidelined.
What’s Trump going to do?
The midterms are 6 weeks away, and polls show the Dems will win the House, with the Senate a close call. I saw a video clip of Trump acknowledging that midterms usually result in the President’s party losing a few House seats, and he shrugged as if it didn’t worry him at all.
FOX commentators are busy painting the Dems as “nasty commies” who will ruin America if they gain control of the House.
Last week, I wondered whether Trump would limit exports of gasoline, diesel, and jet fuel to lower fuel prices in the USA.
Chinese President Xi is due to visit the White House later this week (if he’s healthy), but analysts expect little chance of any “super deal” between the US and China.
Will Trump back down on some of his demands on Iran to reach a “deal” to end the war – which would likely lower energy costs?
Thoughts on trading
I subscribe to several Substack financial market analysts. One of my favourite energy analysts is Riko Kardamow, who lives in Dublin. He does amazingly in-depth research across hydrocarbon markets, and we swap notes from time to time.
Here’s an exchange between us where I share my thoughts about how little I know about markets (and who participates in them), which explains why I overweight risk management and underweight my forecasting abilities.

My short-term trading
I started this week flat, with no open positions. I bought OTM bond calls on Monday as a limited-risk way to bet on a bounce after the sharp bond sell-off. The options had 40 days to expiry. The market has gone a few ticks against me, but I still hold the position. If bonds keep falling next week, I’ll probably take a loss and get out.
I bought and then sold the S&P three times this week for a tiny net loss.
The only position I held into the weekend was the bond calls.
The Barney report
Summer is winding down, but Barney and I are still having some great walks in the September sunshine. This is a photo of him in a 40-acre field where I throw a ball, and he chases it. I tell people he is such a good catcher that if I could teach him how to throw, he could play for the NY Yankees. This is his pose as he waits for me to throw the ball.

Listen to Mike Campbell and me discuss markets
On this week’s Moneytalks show, Mike and I discussed how the soaring prices of crude, and especially refined products, are impacting all markets, especially the credit markets. You can listen to the entire show here. Don’t miss Mike’s terrific interview with my friend Lance Roberts starting around the 5-minute mark. My spot with Mike starts at the 1-hour and 10-minute mark.
The Archive
Readers can access any of the weekly Trading Desk Notes from the past six years by clicking here.
Subscribe: You have free access to everything on this site. Subscribers receive an email alert when I post new content, typically four to six times a month.
Victor Adair retired from the Canadian brokerage business in 2020 after 44 years and is no longer licensed to provide investment advice. Nothing on this website is investment advice for anyone about anything.