There’s more than one Joker in the deck
I pay close attention to market correlations, especially when they suddenly change, because that often signals “something new and important” is in play.
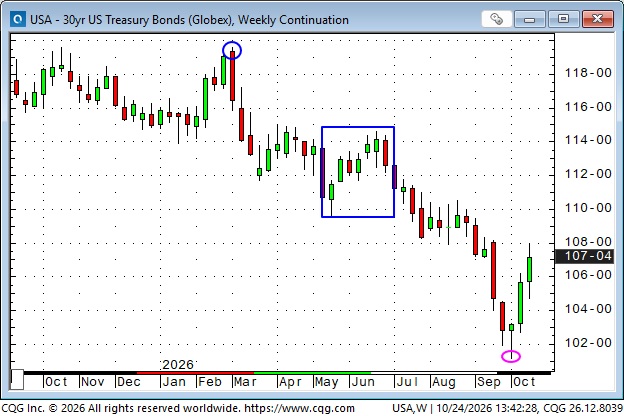
From the start of the war with Iran (blue ellipse), long bond prices generally trended down until early October (pink ellipse), with a counter-trend rally in May/June (blue rectangle).
From the start of the war with Iran (blue ellipse), December 2026 WTI crude oil prices generally trended up until early October (pink ellipse), with a counter-trend decline in May/June (blue rectangle).
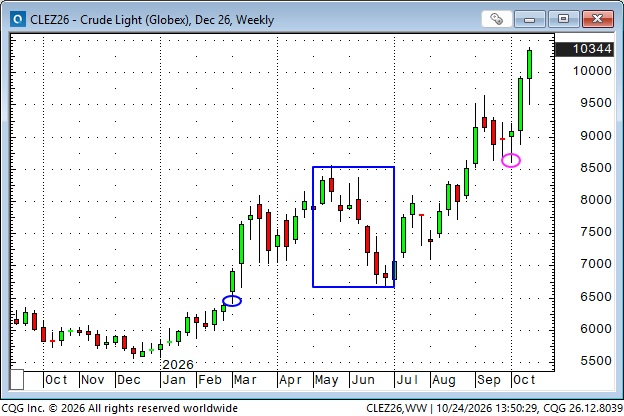
From the start of the war with Iran to early October, WTI and bond prices maintained a relatively strong negative correlation. Intuitively, a negative correlation “makes sense”: sustained higher and rising crude prices feed through to higher energy costs/higher inflation = higher interest rates = lower bond prices.
However, over the past three weeks, both bond prices and WTI prices have rallied sharply; the strong negative correlation has suddenly changed to a strong positive correlation, possibly signalling that “something new and important” is in play.
Intuitively, a surge to new highs in crude “should” cause bonds to fall, but instead bonds have rallied sharply. It seems to me that the bond market, not the crude market, is responsible for the change in the crude/bond correlation, so the question is, “What has caused bonds to rally sharply, even as crude prices have soared to new highs?” What is the Joker in the deck?

Trend changes
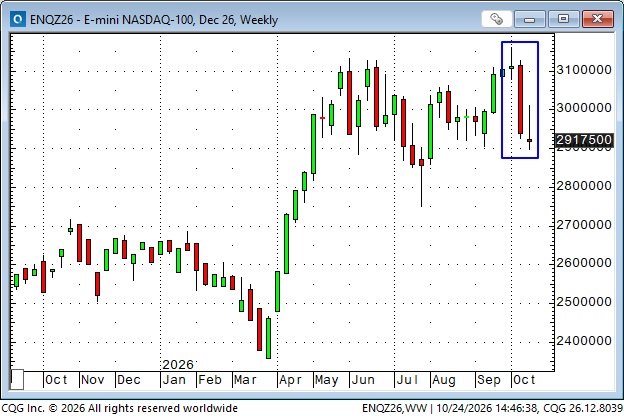
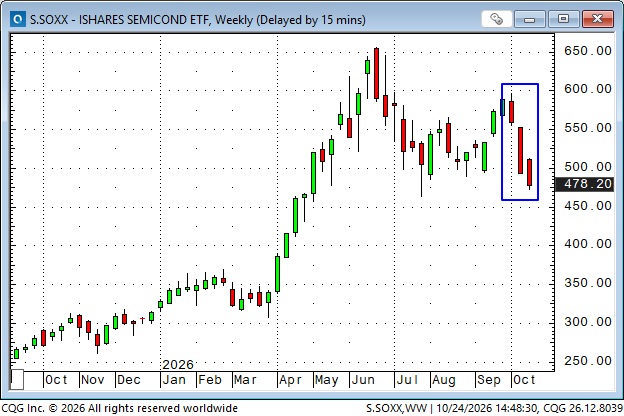
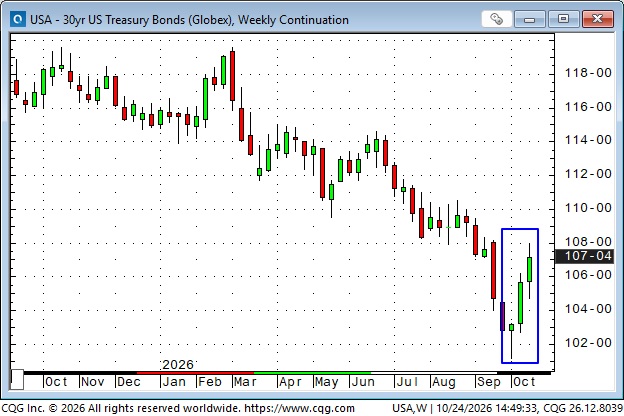
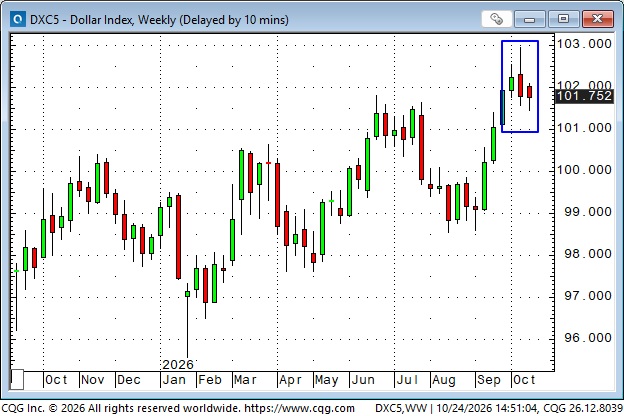
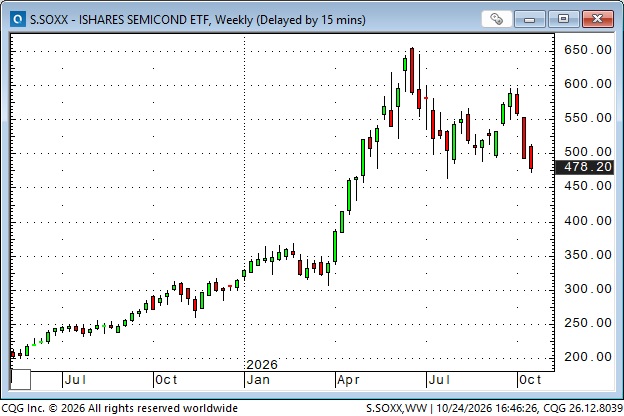
Three significant trend changes occurred in the first week of October: 1) the Nasdaq hit record highs and turned lower, with AI/Semis leading the decline, 2) US Bond prices hit 20-something-year lows and turned sharply higher (while French bond prices continued to fall). US Bond prices also rallied despite higher-than-expected CPI and PPI data, and 3) the DXY US Dollar Index hit 18-month highs and turned lower.
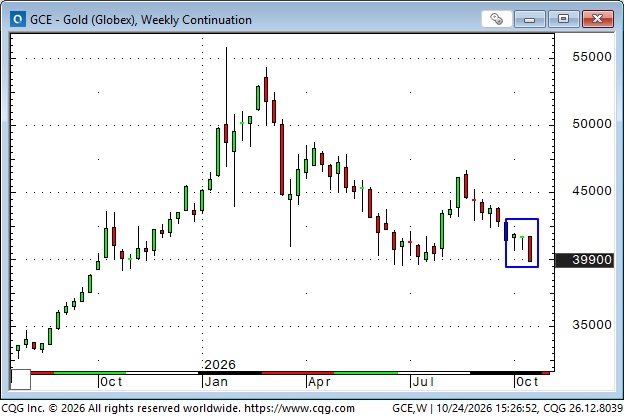
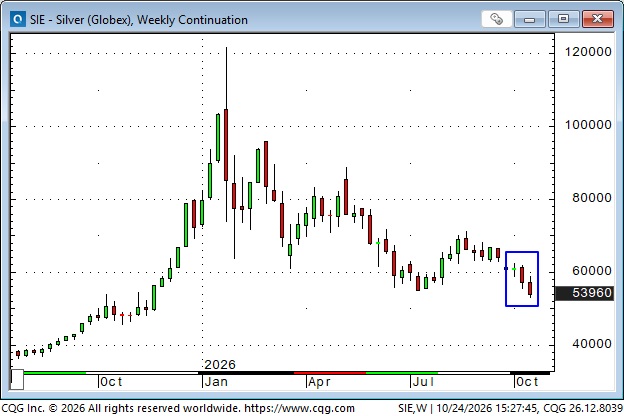
Together, these trend changes suggest an unwinding of crowded positioning and, along with the selloff in gold and silver (silver is down ~15% over the past 3 weeks), a shift in market tone from aggressive risk-taking to a more defensive, risk-off posture.
The Nasdaq
The iShares Semiconductor ETF
US Bonds
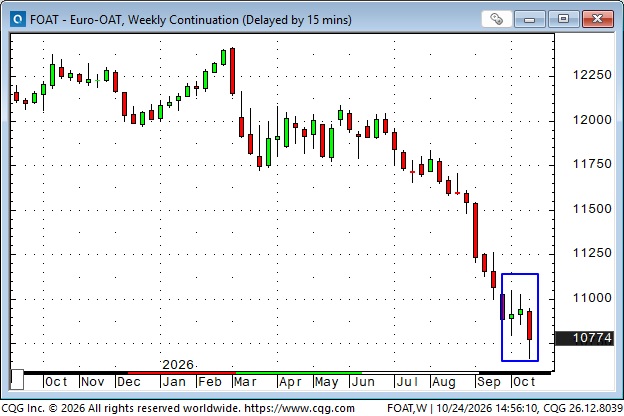
French bonds made new lows this week. French/German spreads widened to ~175 bps, a 15-year record.
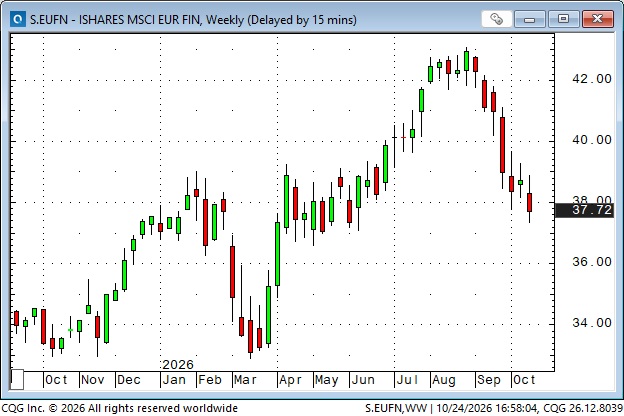
Here’s a look at an ETF of European bank shares, down ~12% since hitting all-time record highs at the end of August.
The DXY US Dollar Index
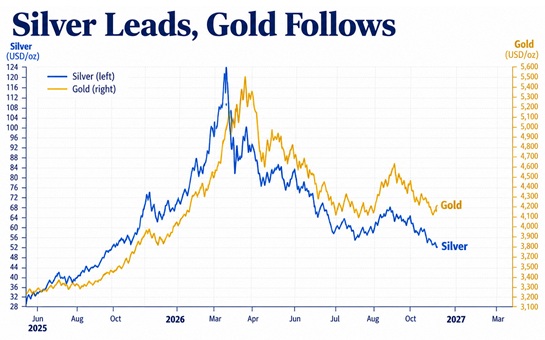
Gold and silver have dropped over the past three weeks even though the US Dollar has been weaker and interest rates have been lower. This may reflect speculative deleveraging. Gold and silver are also in a technical downtrend, trading below a downtrending 200 DMA.
Silver
In recent Trading Desk Notes, I have noted that “questions” about AI have circulated for the past few months, but the “intensity” of those questions ramped up over the past three weeks as the Nasdaq fell away from all-time highs.
Answering my own question
“What has caused bonds to rally sharply, even as crude prices have soared to new highs?”
1) US bond yields had reached 20-something-year highs in early October, and the speculative short trade was crowded. Any “spark” could have ignited a short-covering rally.
2) With bond yields at 20-something-year highs, some investors started to “nibble.” The classic 60/40 portfolio had been a dog for the past 4 years, but some long-term investors saw merit in “rebalancing” away from soaring equity markets and into bonds. Pension funds, with their future liabilities fully funded by the soaring equity markets of the past few years, may have decided that some “rebalancing” would be prudent.
3) The “questions” about AI became “concerns” and triggered a “cross-asset” shift in market tone from aggressive risk-taking to a more defensive risk-off posture. Speculators covered shorts, and real-money accounts bought bonds.
4) The “concerns” about AI go deeper than just the possibility of a break in the equity market. The massive data center buildout is a primary driver of the US economy, and if its growth slows, the economy slows. People buy bonds during economic slowdowns.
Regular readers may remember that I’ve often posted a chart of CAT as a below-the-radar “picks and shovels” play on the data center buildout. CAT soared ~300% from last year’s Liberation Day lows to July’s highs. It’s down ~36% from those highs.
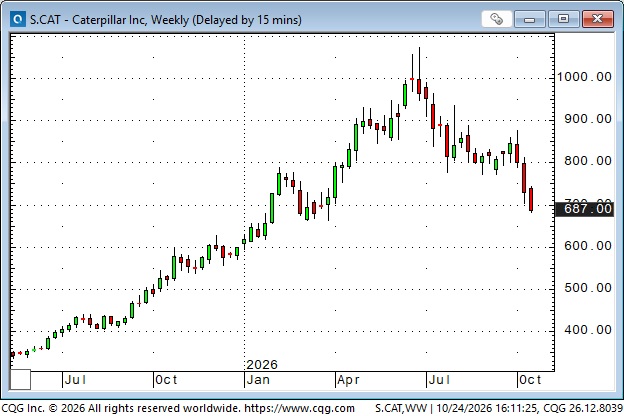
CAT has closely correlated with SOXX since Liberation Day.
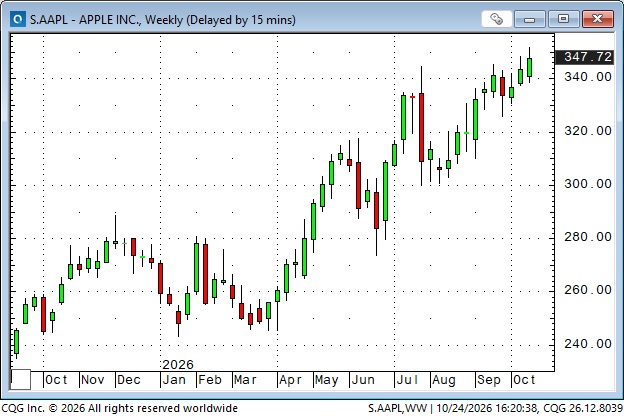
Last week I noted that AAPL (The Last Man Standing) had been bid to new record highs as “AAPL looked to be getting safe-haven flows as other tech stocks fell. AAPL is in a class by itself. It has the highest market cap, a history of innovation, and it’s a leading tech company, but it’s not “tainted” by the questions swirling around AI companies. If you’re a money manager and you have to be invested in the tech sector, AAPL looks like a “shelter from the storm.”
AAPL is up again this week as the tech selloff intensified, even though AAPL’s P/E is ~40%.
While the S&P has retreated from record highs made three weeks ago…
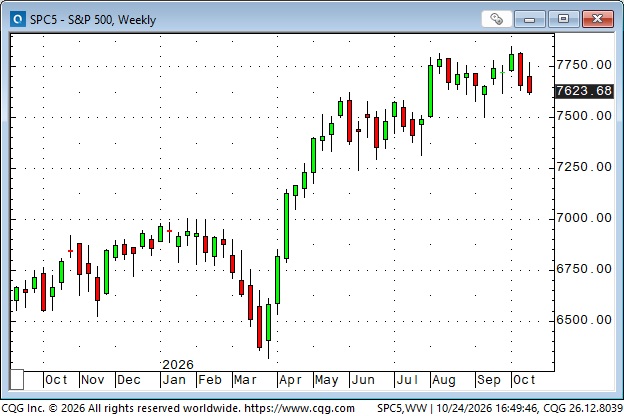
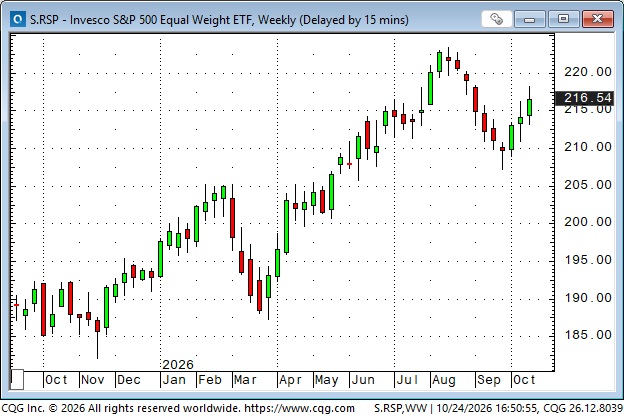
…the equal-weight S&P has rallied. Rotation, not liquidation.
Q3 earnings reports
About 24% of the S&P 500 have reported for Q3 so far. GOOG and MSFT on Wednesday and AMZN on Thursday will be important.
Currencies
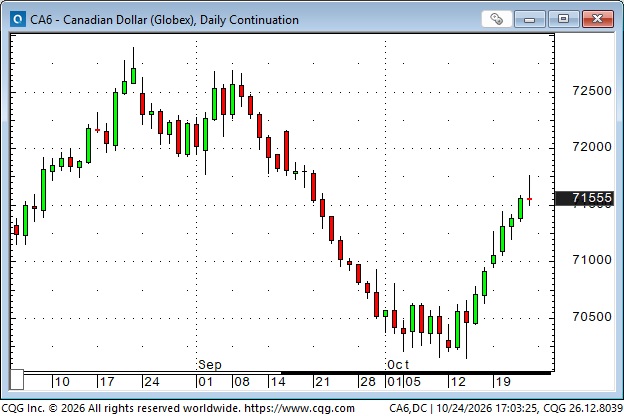
The Canadian Dollar has rallied over 150 points in the last 2 weeks as the 2-year US interest rate premium over Canada has narrowed from ~170 to ~140. The Bank of Canada meets next week (markets are pricing in 1 or 2 25bps hikes before Year-end). The FOMC, the ECB and the BoJ also meet next week. The BoE and the RBA meet the following week.
Energy
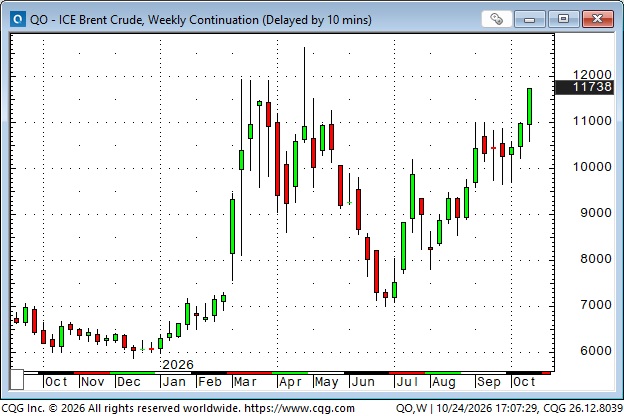
Front-month Brent crude oil futures posted their highest weekly close since 2022 this week, at ~$117.
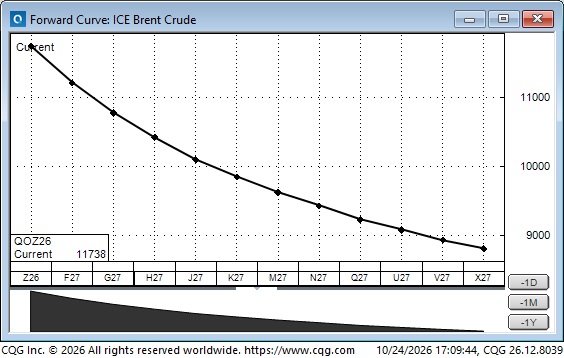
December 2027 Brent (one year forward) is ~$88, a $29 backwardation.
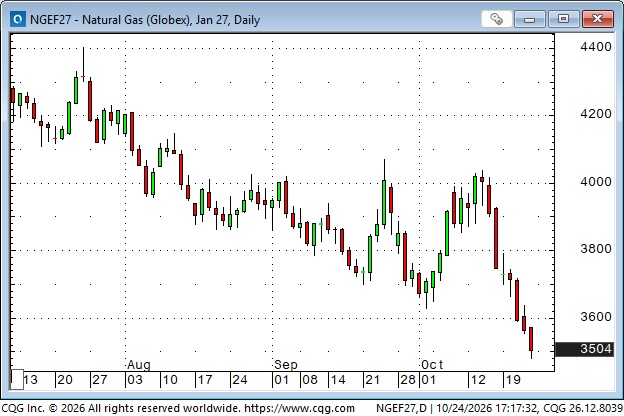
NYMEX Henry Hub January 2027 natural gas closed this week at ~$3.50, a life-of-contract low. This contract traded above $5.50 in March 2026. A lot of natural gas is coming out of the ground in the USA—drill, baby, drill.
My short-term trading
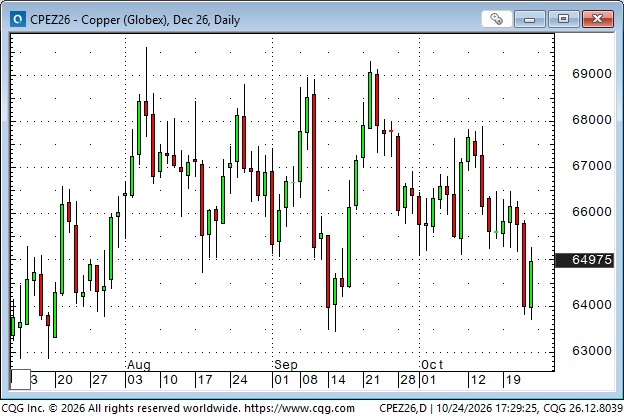
I started this week short the Euro and Copper. I got stopped out for a small loss on the Euro when it popped higher on Tuesday.
I stayed short copper and have lowered the stop to ensure a profitable trade. Copper tumbled ~18 cents on Thursday but bounced back ~10 cents on Friday. My rationale for shorting copper: I understand the bullish narrative, but if AI fades, copper prices might weaken, and OI is at all-time highs. We’ll need a lot of copper over the next few years, but we don’t need it right now.
The Barney report
Barney loves to run with a stick in his mouth; he loves to chase a ball, and from time to time, he likes to dig a hole. I don’t think he’s looking for something; it’s just DNA kicking in.

Listen to Mike Campbell and me discuss markets
On this week’s Moneytalks show, Mike and I discussed the AI- and big-cap tech-led stock market break, the breakdown in the crude oil/bond market correlation, and the unwinding of speculative positioning across markets. You can listen to the entire show here. My spot with Mike starts around the 1-hour, 5-minute mark.
The Archive
Readers can access any of the weekly Trading Desk Notes from the past six years by clicking here.
Subscribe: You have free access to everything on this site. Subscribers receive an email alert when I post new content, typically four to six times a month.
Victor Adair retired from the Canadian brokerage business in 2020 after 44 years and is no longer licensed to provide investment advice. Nothing on this website is investment advice for anyone about anything.