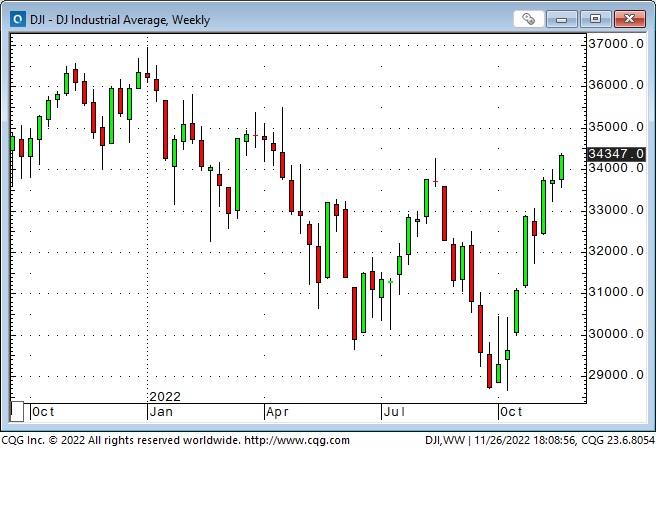
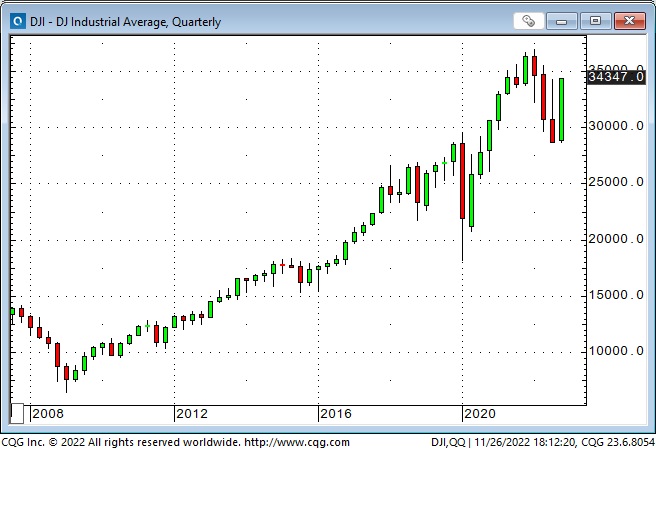
The DJIA closed at a seven-month high this week
The DJIA closed higher for seven of the last eight weeks. It rallied ~5,600 points (19%) from its two-year lows on October 13 and is now only ~7% below its January All-Time Highs.
All of the stock indices had a terrific rally from the March 2020 Covid lows to their ATH: The Nasdaq rallied ~145%, the S+P ~120%, the DJIA ~105%, and the TSE ~99%.
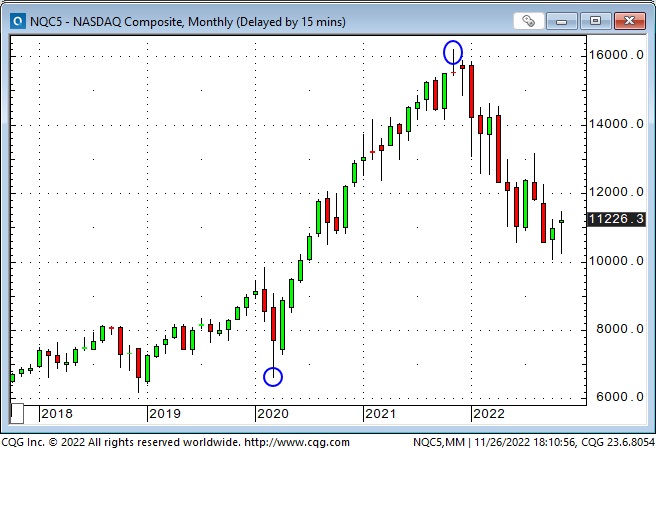
All of the stock indices had a substantial decline from their ATH to the October 13 lows: The Nasdaq fell ~38%, the S+P ~27%, the DJIA ~22%, and the TSE ~20%.
The DJIA, now only 7% below ATH, has rallied harder than any of the other indices from the October 13 lows: the S+P is ~16% below its ATH, the Nasdaq ~30%, and the TSE ~8%.
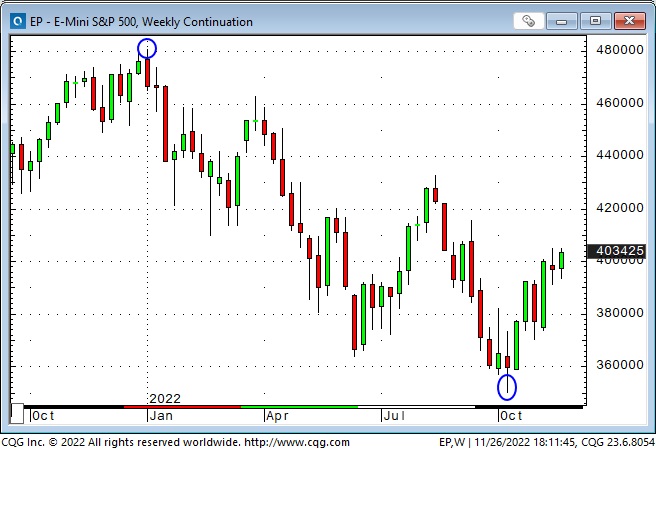
The most important thing driving stock indices down from their ATH was the prospect of the Fed ramming interest rates sharply higher to cool inflation. In November 2021, the two-year Treasury yield was around 0.5%; in November 2022, it was >4.5%.
The most important thing driving the stock market rally from the October 13 lows is the expectation that the Fed will slow and then stop raising interest rates soon.
The stock market’s reaction to the prospect of a less hawkish Fed has been much more exuberant than the reaction in the credit and currency markets. (But then, as Howard Marks likes to say, “In real life, things fluctuate between pretty good and not so hot, but in the (stock) market, things go from flawless to hopeless.)
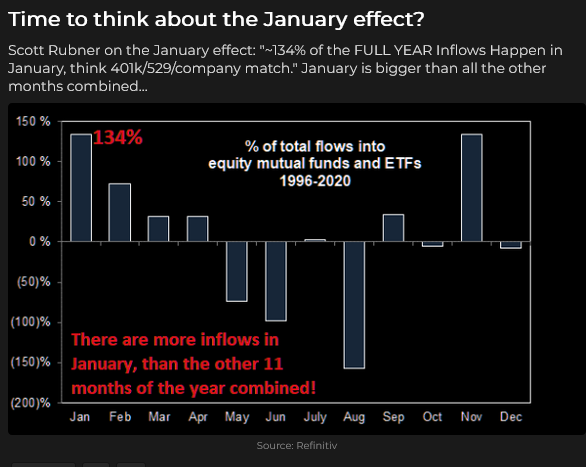
People want to buy stocks
Would you short this chart?
How do we measure inflation?
The stock market’s expectation that the Fed will slow and then stop raising interest rates is based on the idea that YoY headline CPI inflation has peaked and will trend lower. Eddy Markus, Chief Analyst at ECR Research in Holland, does not see US interest rates declining in 2023. He believes the Fed needs to sustain higher interest rates to keep inflation expectations in check. Eddy posed an interesting question: what measure of inflation will the market use going forward? Base effects will cause YoY inflation to fall – but is that the proper metric to use? My thought, after reading Eddy’s latest piece, is that the MoM inflation rate might be better because it’s the delta (rate of change) of inflation that is most important.
Bonds
Bonds have had a horrible year (the 10-year Treasury yield hit a 14-year high in October), and relative to stock indices, they have had a very weak bounce after the considerable fall they suffered over the past twelve months.
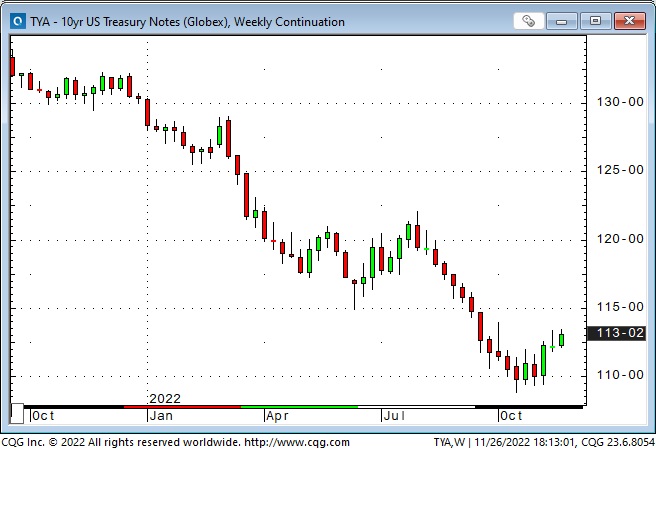
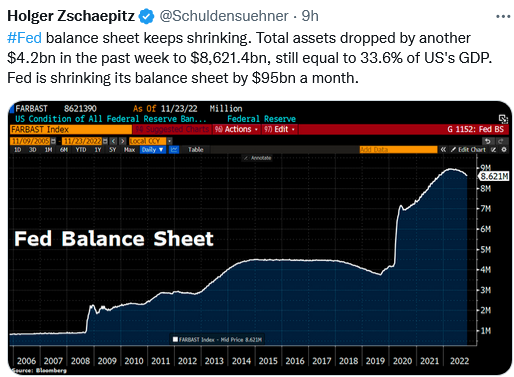
Bonds are probably catching a short-term bid lately because of a looming recession, but relentless QT from the Fed and selling from foreign Central Banks will continue to weigh on prices. The weak rally in bond prices may also signal a worry that inflation won’t fall to 2% anytime soon and that a new era of higher inflation, higher deficits and higher debt service costs is not a bond-friendly environment.
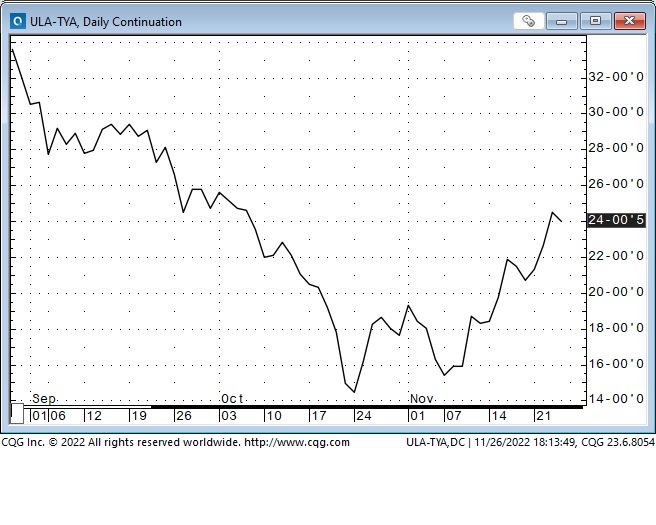
Longer-term bonds are rallying relative to shorter-term bonds. This chart shows the Ultra-long US Treasury futures contract rallying Vs. the 10-year TNote futures since the October lows.
The forward Eurodollar curve is now pricing interest rates to peak in June 2023 (last month, the peak was expected to be March 2023) and to then fall ~44 bps by December 2023.
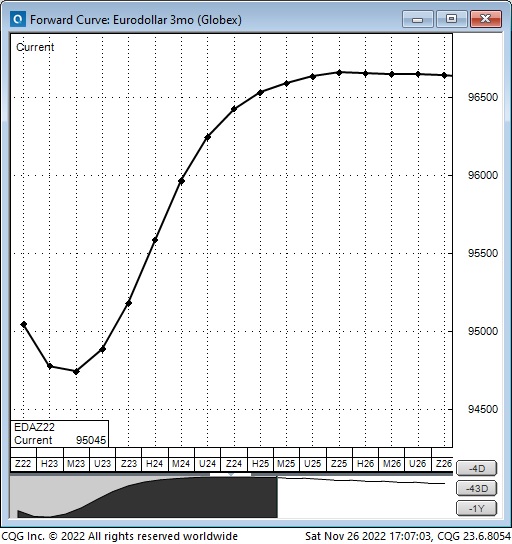
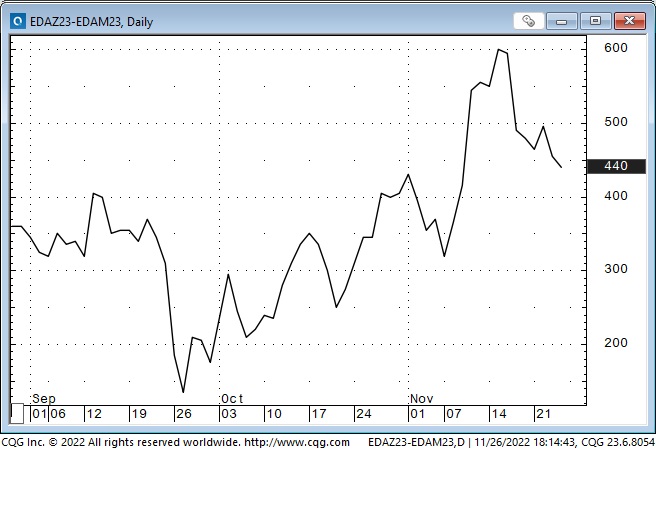
Traders who think the Fed will keep rates steady throughout 2023 might consider buying June/selling December Eurodollars. Traders who think a severe recession will cause the Fed to cut interest rates sharply might consider selling June/buying December Eurodollars.
Currencies
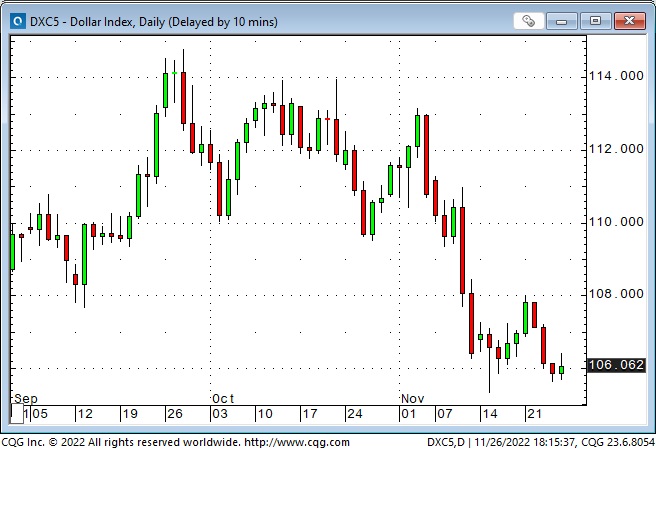
The US Dollar Index hit a 20-year high in September – up ~29% from its January 2021 lows. One critical support for that astonishing rally was the market’s perception (certainly over the last year) that the Fed would maintain a much more aggressive monetary policy than other Central Banks. As markets now anticipate a “slowing” from the Fed, the USDX has weakened by ~8%.
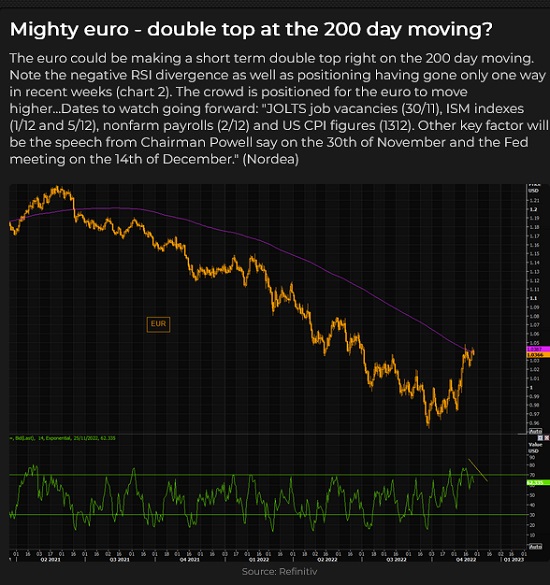
The consensus view in the FX market seems to be that the 20-year low in the Euro in September (and the 32-year low in the Yen in October) are major inflection points. That may be correct, but if the Fed sustains higher interest rates to “fight” inflation, especially if a recession seems likely, or if asset prices (stocks and real estate) weaken, then I expect the USD will rally.
This chart shows that non-commercial (speculators) accounts have been aggressively buying Euros over the past few weeks.
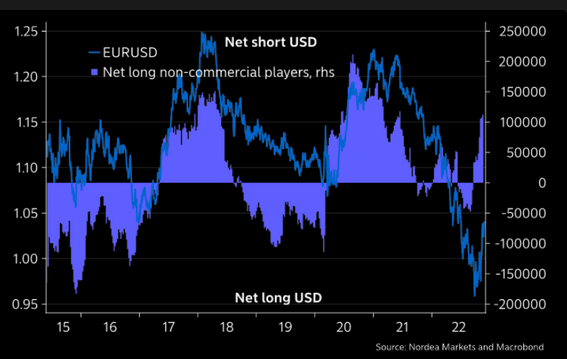
Is buying the Euro here the right move?
Is a recession coming?
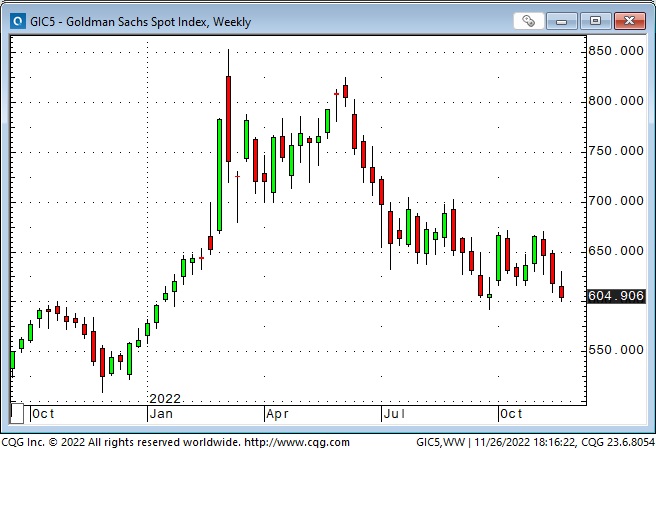
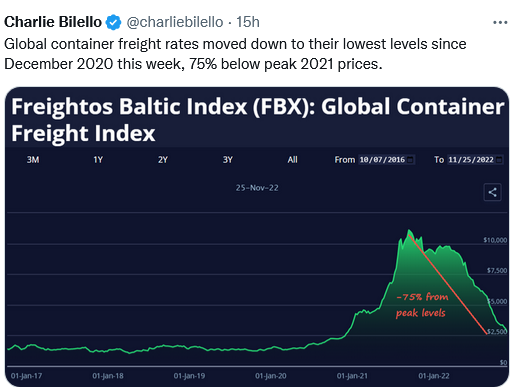
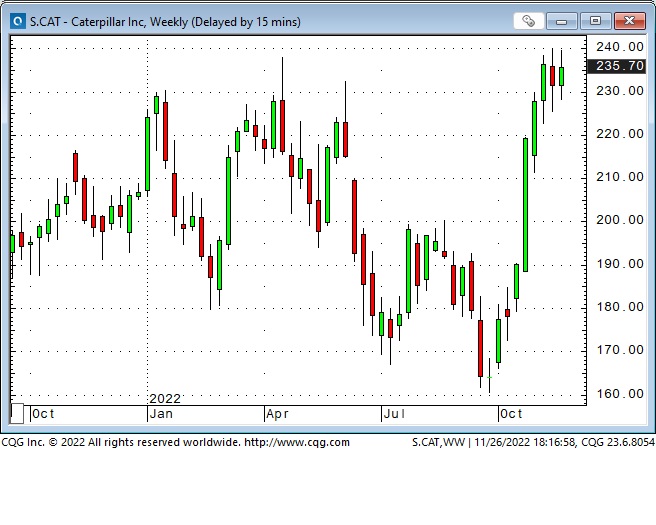
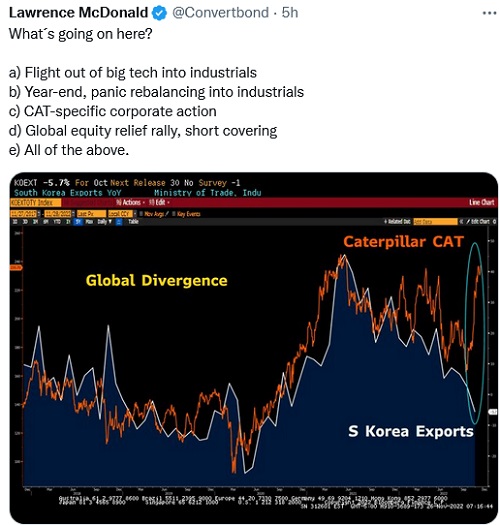
Yield curves are inverted, and inversions have historically foreshadowed a recession, with the recessions starting once the inversions reverse. Commodity indices are falling as China slows. High-profile layoffs have been announced, consumer sentiment is falling sharply, mainly on inflation worries and credit card debt is at record levels. A possible nationwide rail strike is brewing while the homebuilding industry struggles. A recession looks likely; the question is whether it will be mild or severe.
I’m puzzled by this chart. If a recession is coming, why is CAT going up? (You might think that if people saw a recession coming, they would NOT be buying this stock.) Is it simply a result of Big Money rotating out of Big Cap Tech, and it has to go somewhere – so it goes into other Big Cap stocks? Would you short this stock?
Energy
Front-month WTI futures registered their lowest weekly close ($76.50) of the year this week, down ~$53 (41%) from the highs made after the Russian invasion.
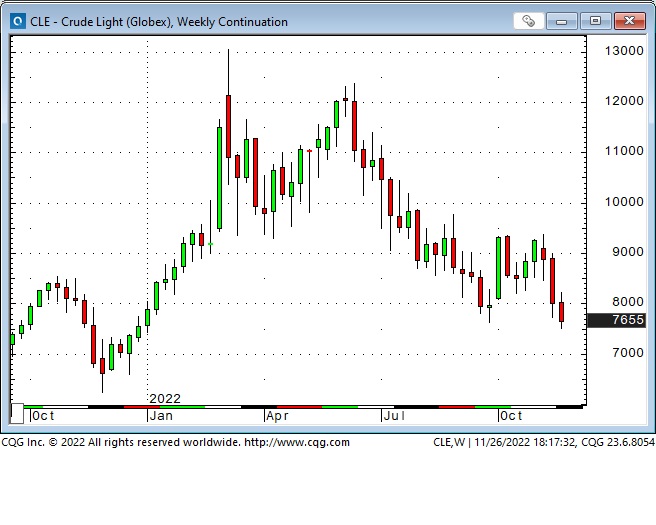
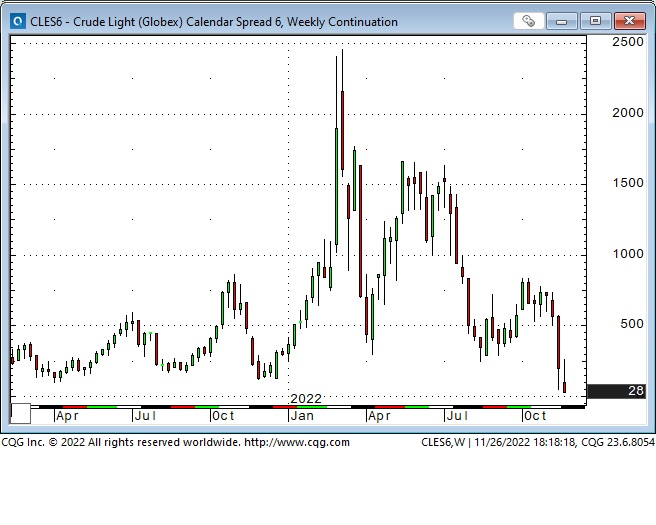
The 6-month forward WTI contract was a $24 discount to the front month following the Russian invasion. Since then, the backwardation has declined but was generally seen by traders as a bullish signal. This week the nearby months have gone to a small contango – another sign of demand weakening relative to supply.
European Natgas prices are down ~50% from this year’s highs, while Nymex Natgas prices are down ~30% from this year’s highs.
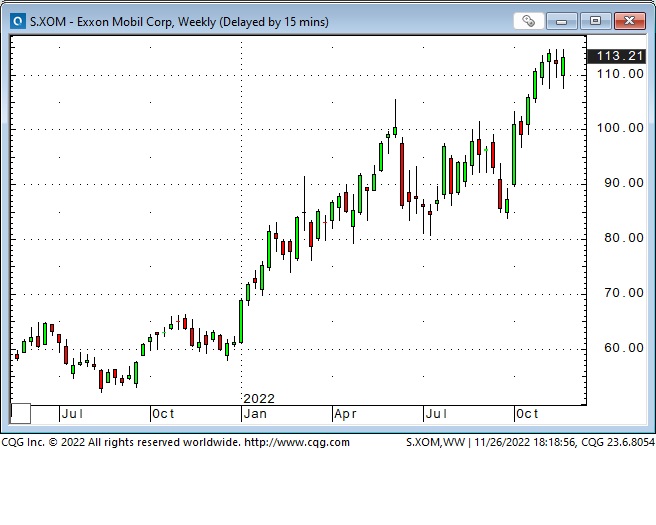
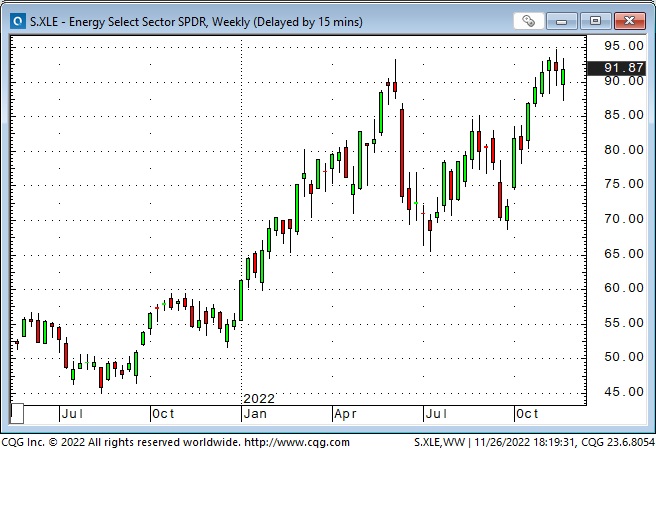
Share prices of many North American oil and gas companies remain near this year’s highs, despite the sharp declines in Nymex energy futures. Why is that?
My short-term trading
I started this week with short Euro and S+P positions established last week. I covered both positions on Monday; good profits on the Euro, a slight loss on the S+P. I took two more small losses shorting the S+P on Monday and Tuesday, but I got turned around and bought it Tuesday. I covered that position on Wednesday ahead of the FOMC minutes for a decent profit.
I shorted CAD, Euro and the S+P on Thursday and Friday but covered all three for minimal losses. (I had small open gains in all three positions, but with the Dow surging higher, I decided to get flat when the trades turned against me.) This is the seasonally strong time of the year for stocks.
I sold the S+P short at the end of Friday and held that position into the weekend. The market seems “too bullish” to me, but if it opens higher Sunday afternoon, I’ll cover the trade.
On my radar
Scheduled events this coming week include Jolts, ISM, PCE and UE data and a Powell speech. I’m inclined to think the market is getting ahead of itself in expecting the Fed to “back off.” If I’m right, the USD should rally against other currencies and gold, and stock indices should weaken.
Despite my “hunches,” I’ll make my trading decisions based on price action.
The Archive
Readers can access weekly Trading Desk Notes going back five years by clicking the Good Old Stuff-Archive button on the right side of this page.
I spent an hour last weekend reading a random selection of previous Notes. One thing that surprised me was that markets were more volatile than I remember. I guess I’m looking at current market conditions so intensely that I tend to think of previous market conditions as relatively flat, and they weren’t!
The Barney report
My grandmother used to have a polite term to describe willful or unruly children – she referred to them as a “handful.” This week I had Barney out for an on-leash walk in a howling windstorm. Let me tell you, a puppy in a windstorm, with leaves and other things blowing everywhere, is a handful!
Here he is with one of my wife’s shoes – there’s never a dull moment when he’s around!

The 33rd Annual World Outlook Financial Conference at the Bayshore Hotel, Vancouver, February 3 & 4, 2023
Mike Campbell’s hugely popular annual conference will be back LIVE AND IN PERSON at the Bayshore Hotel after two years of Covid restrictions. Mike and his team have again created a fantastic roster of speakers and exhibitors. I’ve attended every one of these conferences, and with all the turmoil and confusion in today’s markets, I highly recommend my readers make plans to attend. You can get all the information you need here.
Listen to Victor talk about markets
I’ve had a regular weekly spot on Mike Campbell’s Moneytalks show for >22 years. The November 26 podcast, with special guest Sam Cooper, is at: https://mikesmoneytalks.ca.
I recorded an interview with commodity trading legend Yra Harris on November 15 for the Financial Repression Authority. We discussed macro markets with more than a few references to life in the Chicago trading pits years ago! Here’s a direct link to the interview.
I did my regular monthly review of macro markets with Jim Goddard on the “This Week In Money” show on Saturday, November 12. My old friend, Ross Clark, is on the program as is the one and only Marc Faber. You can listen here.
Headsupguys.org
Market stress can drive people over the edge – maybe people you know. Headsupguys.org is a project at the University of British Columbia that helps men deal with depression. They have had over 5 million hits on their website from people worldwide, and they have saved hundreds of lives. They are there to help. Reach out – stay alive.

Subscribe: You have free access to everything on this site. Subscribers receive an email alert when I post something new – usually 4 to 6 times a month.
Victor Adair retired from the Canadian brokerage business in 2020 after 44 years and is no longer licensed to provide investment advice. Nothing on this website is investment advice for anyone about anything.