The Anti-dollar trade
Last week I wrote: Gold bugs have believed for years that gold is the original Anti-dollar, but lately, the Euro currency has become known as the Anti-dollar...If a currency trader has a negative view of the USD, buying EURUSD is the go-to trade.
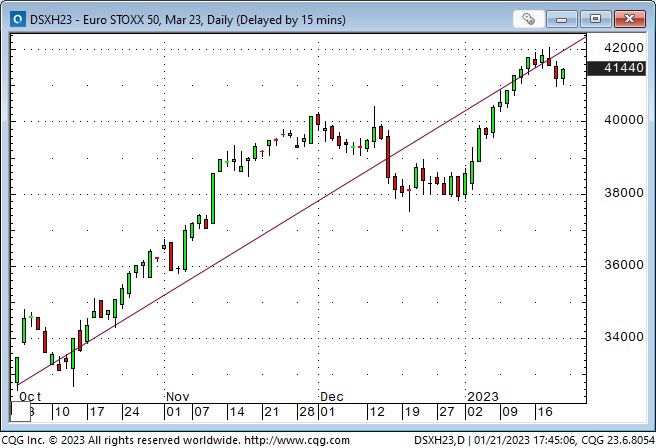
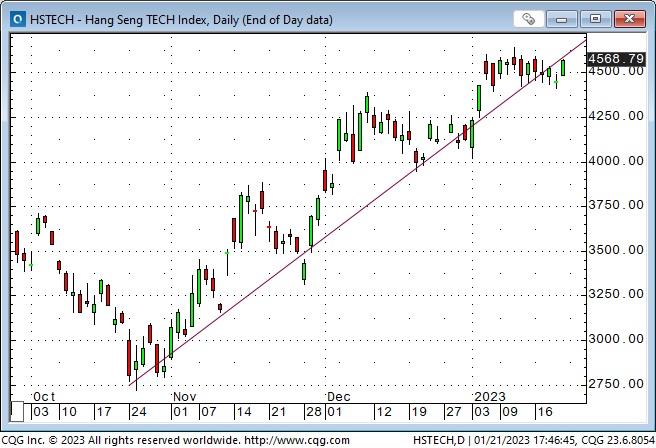
But if a trader/investor had a negative view of the USD since it peaked in late September 2022, several markets have qualified as excellent Anti-dollar trades. For instance, long the Euro Stoxx 50 Index, up ~28%, long the Chinese tech index, up ~35%, or long the EM stock index, up ~20%.
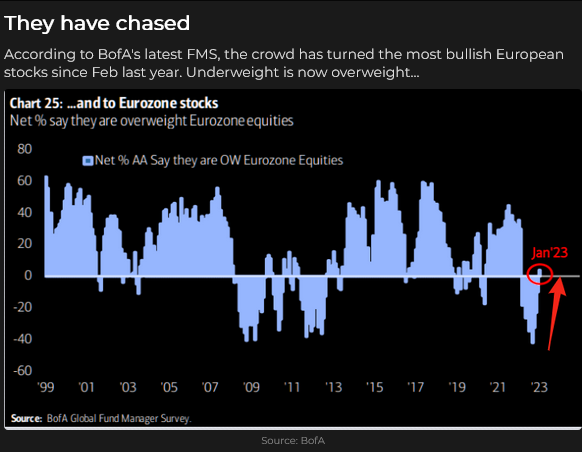
Bank of America’s Fund Manager Survey shows a recent dramatic flow of capital into European stocks.
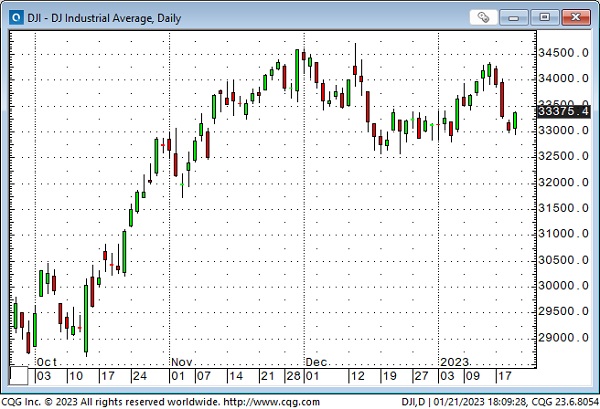
The DJIA has risen ~15% in USD terms since late September, although the Nasdaq is little changed since then.
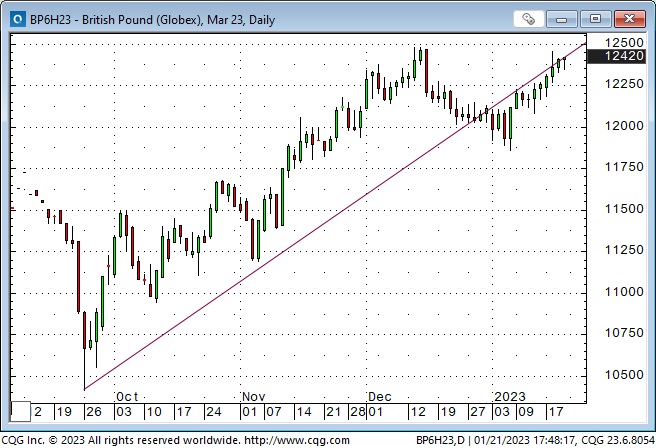
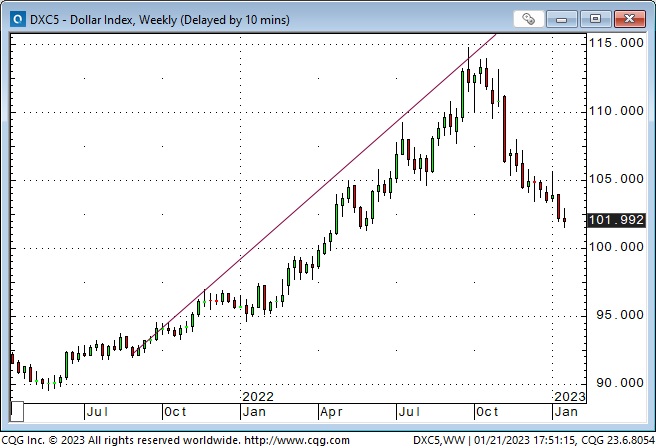
Virtually every Eurozone currency has risen against the USD, especially the British Pound, up nearly 20% since hitting 37-year lows in late September 2022. The Euro is at a 9-month high, up ~13% from 20-year lows made in September, while the USDX is at a 7-month low, down ~11% from the 20-year highs it reached in September.
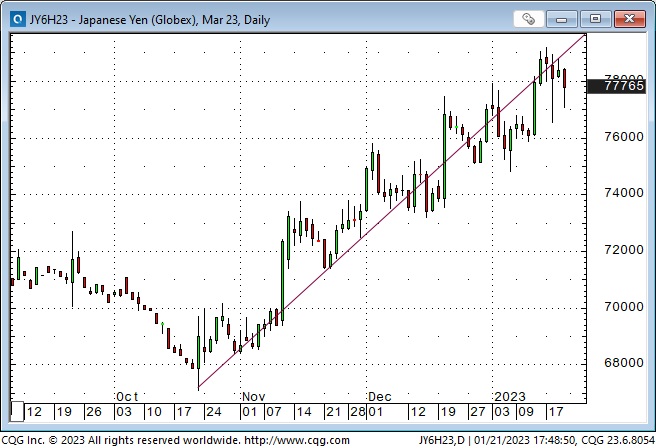
Virtually every Asian market currency has risen against the USD, including the Chinese RMB, the Sing dollar, the Korean Won and especially the Japanese Yen, which is up nearly 13% from its late September lows and up ~19% from its 32-year lows in mid-October.
Even the Canadian dollar, which I described last week as a “subset” of the USD (in the eyes of global currency traders), is up ~3%.
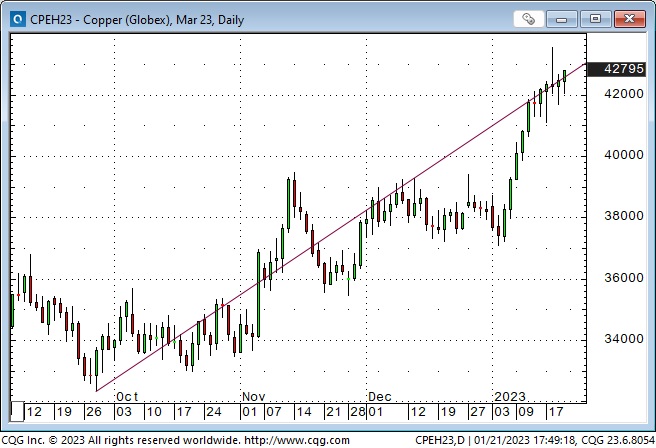
Copper is up 30% in USD terms since late September, at a 7-month high, while the USDX is at a 7-month low.
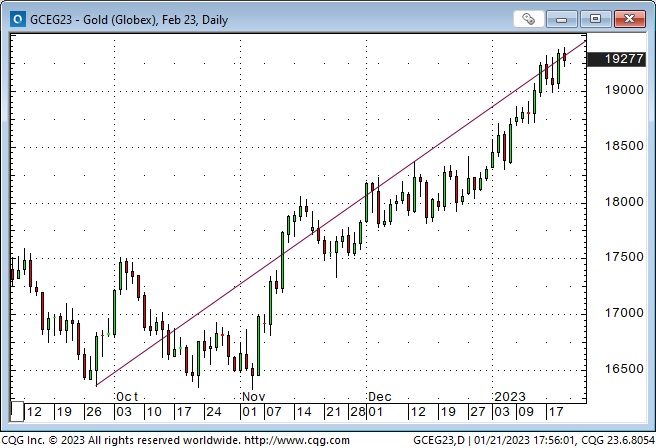
Silver is up ~30% in USD terms, at a 9-month high, while gold, the “original” Anti-dollar, is up ~$300 or 18% at 9-month highs.
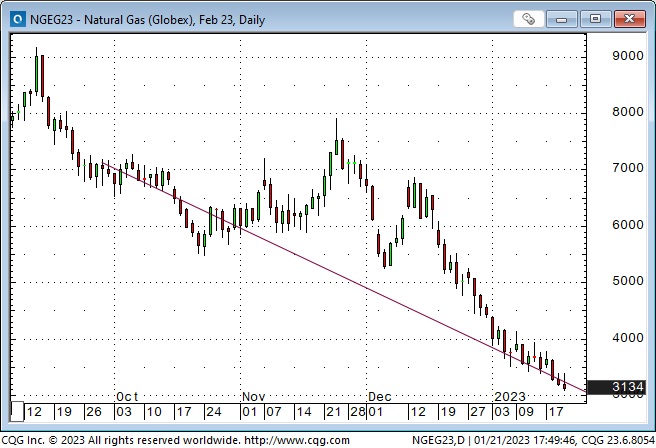
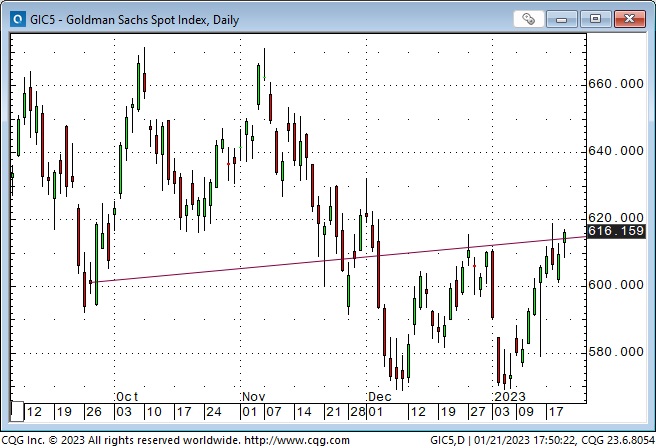
Notable, the “fossil fuel” markets have not been an Anti-dollar play since late September, especially NYMEX Natural Gas which has fallen >50%, in USD terms, since late September. The Goldman Sachs commodity index is about unchanged since September.
What is the “USD,” and why have these markets risen in USD terms?
The S+P 500 is an index of ~500 different publicly traded large-cap stocks, but I have often noted that price changes in the S+P index seem to reflect changes in the market’s “risk appetite.” I’ve called the S+P a “risk barometer,” and I’ve often witnessed very tight correlations between fluctuations in the S+P and changes in other financial markets.
So if the S+P is a “risk barometer,” what is the USD? It can also be a “risk barometer,” it jumped when Russia invaded Ukraine and rallied ~20% over the next seven months as capital sought “safety” in the US Dollar.
Last week I noted that the rally that lifted the USDX to a 20-year high in 2022 was the biggest/steepest rally since 1984 when the USDX soared >30% in 12 months.
I also noted that The most significant part of the USDX rally (up ~23%) happened between Sept 2021 and Sept 2022, when the market was pricing the Fed as the most aggressive Central Bank. In late September 2022, markets began to price in the Fed becoming less aggressive while the ECB became more aggressive; the USD turned on a dime and began to fall; the Euro turned on a dime and began to rally.

So the USD, in addition to being a “risk barometer,” has also been a “play” on Fed policy relative to the policies of other central banks.
Positioning
I’ve traded currencies for ~45 years, and I have a few “mottos” which stand the test of time. One is that capital flows to America for safety and opportunity. Another is that trends in the currency markets seem to go WAY further than makes any sense, and then they turn on a dime and go the other way.
Over the past two years, I’ve frequently referenced the “inflection point” of January 6, 2021, when the USDX hit a 3-year low as the Capitol Building in Washington, DC, was overrun.
By September 2022, markets had fully embraced King Dollar and everything it represented, including safety, opportunity, and a play on the world’s most determined and aggressive Central Bank. “The whole world” was long the USD. By late September, the 10-year US Treasury note yield was hitting 15-year highs.
And then on September 26, there was another “inflection point” for the USD as the British Pound hit a 37-year low and began to recover, the Euro fell to a historic low against the Swiss Franc and began to recover, and “the whole world” began to unwind their long USD positioning. Since then, some people have embraced different versions of the Anti-dollar.
Is the decline in the USD since September 2022 only a correction, or was that a significant turning point?
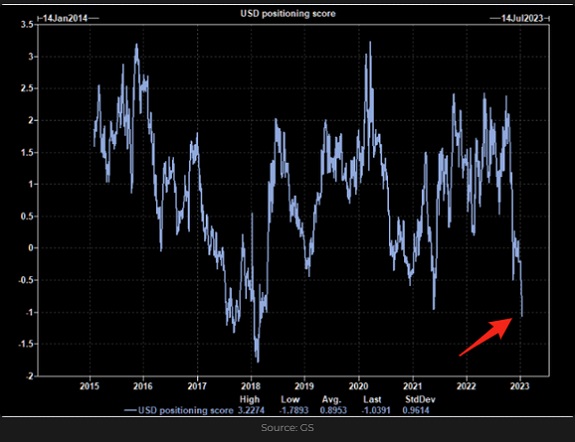
I don’t know, but my bias is that the rush into the Anti-dollar has been overdone. At the very least, if the September inflection point was a significant turn in the currency markets, I would still expect the USD to “test” its September highs before making new lows.
This Goldman chart shows USD positioning as the most bearish in five years.
My short-term trading
This year I’ve been looking for opportunities to be short the Euro and the S+P. I didn’t see any opportunities to short the S+P until this week and got short Wednesday with a stop above Tuesday’s highs. The S+P sold off hard on Wednesday/Thursday, and I was ahead by>100 points at Thursday’s lows. I lowered my stop, and it was hit Friday for a gain of ~40 points.
I began the year with a long put position on the Euro and closed that for a good gain in the first week of trading. I waited for the Euro to rally back and then began a frustrating period of selling lows and getting stopped on highs as the Euro chopped sideways in a narrow range this week.
I went long gold puts early this week when gold reversed off of new highs. (I discussed why this trade looked interesting in last week’s TD Notes.) The trade saw a little daylight for two days, but I closed it for a slight loss on Friday. I liquidated a short Euro position and a short gold position (long puts) going into the close on Friday. The trades were not working, so I decided rather than holding them into the weekend to “clean the slate” and start over next week!
On my radar
Gold seemed to have been “abandoned” as it was making 30-month lows from September to November. The gold ETF market had net selling of ~400 tonnes in 2021 and 2022. Prices were down ~$450 from the All-Time Highs made on the Russian invasion. Interest rates (nominal and real) were at multi-year highs, and the USD had surged to 20-year highs. Gold jumped ~$100 as the USD fell from its peak in late September but couldn’t sustain those gains and fell back, making slightly lower lows in early November.
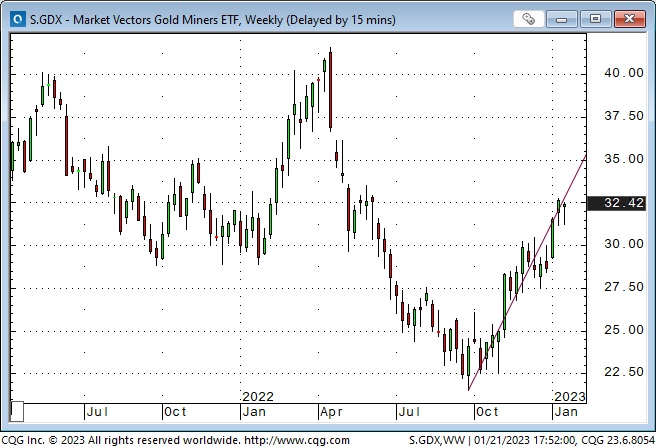
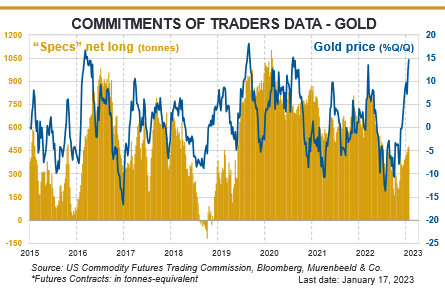
But one month later, gold was ~$200 higher. During my interview with Mike Campbell on the Moneytalks podcast this morning, I described the recent gold rally as a “stealth” rally. It has rallied ~$325 in just over two months while there has been virtually no buying in the gold ETF market. Net speculative futures positions have jumped on the COMEX but are still well below positioning on the Russian invasion. It’s like the rally has happened with relatively little retail participation. The GDX Gold Miners ETF has jumped ~50% from its September low.
This chart, courtesy of Martin Murenbeeld / Capitalight Research, shows Comex spec positioning is up but has not surged on the latest gold rally.
I wonder if “real money” accounts are buying gold in anticipation of central banks returning to their “money printing” ways later this year. Markets are anticipating an end to Fed tightening, not only because inflation is falling but also because a recession is looming. Markets also expect a tsunami of bonds ($6T) to be issued by the US, UK, Europe and Japan this year which might mean Central Banks “print money” to buy bonds to keep debt service costs from spiralling higher. The need to “print money” would be even greater if China and/or Japan decided to start selling Treasuries.
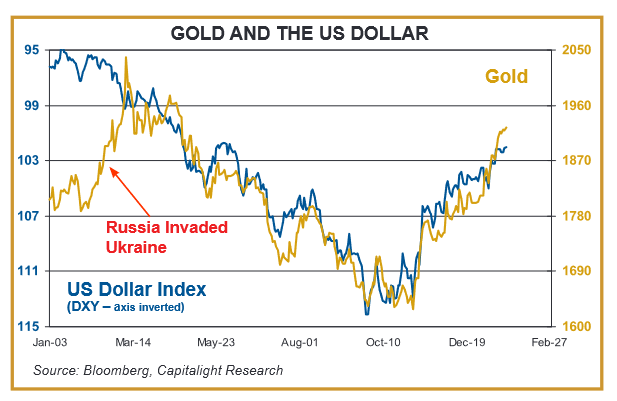
I don’t need to pretend that I “know why” gold prices have risen. It might be entirely due to Central Bank official (and unofficial) buying. What I do know for a fact is that gold’s rally has been highly correlated to the fall in the USD, and if that has been “overdone,” then gold may be due for a correction.
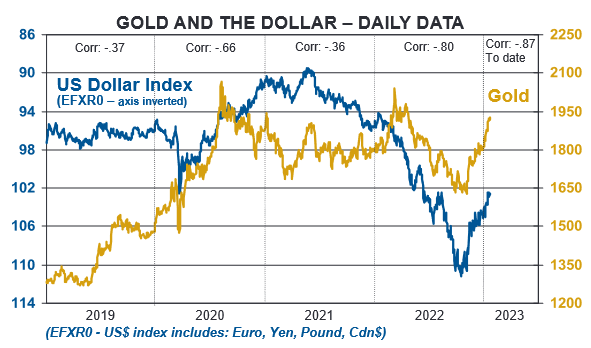
This chart shows the strong (negative) correlation between the USD and gold over the last year.
This chart shows the correlation between the USD and gold over the last four years. Like a lot of correlations, the tightness comes and goes. Check the correlation ratios in the top column of each year. Year-to-date at -.87 is the strongest of the past four years.
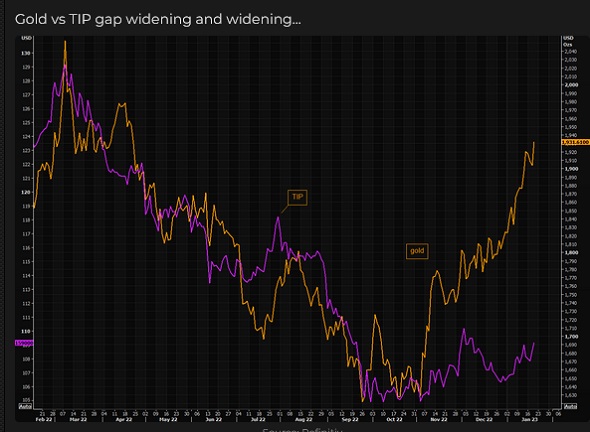
This chart shows the breakdown of the formerly tight correlation between gold and real interest rates as portrayed by TIPS (Treasury Inflation Protected Securities.)
Thoughts on trading
I’ve been guilty of not keeping the time frame of my trading in sync with the time frame of my analysis. My analysis has been longer term than my trading. I’ve been anticipating possible moves in the markets, but rather than waiting for those moves to happen, I’ve “jumped the gun,” trying to get positioned ahead of the action. I realized that on Friday, so I closed out my losing positions in gold and the Euro. I wanted to give myself a “clean slate” to start next week rather than having to “defend” underwater positions.
More thoughts on Trading
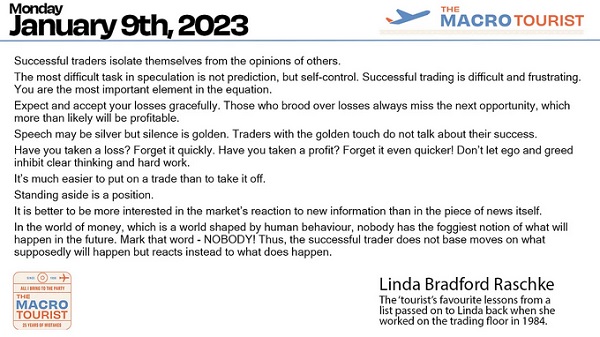
I attended a two-day trading seminar about 25 years ago and was very impressed with Linda Raschke’s presentation. I saw this list of rules on Kevin Muir’s Macrotourist website and had to “steal” it!
I read Victor Sperandeo’s terrific book “Trader Vic – Lessons of a Wall Street Master” many years ago.
The Barney report
My wife was away for three days this week, visiting friends and family in Vancouver and Victoria, so Barney and I had much time together. I love the little guy (65 pounds), and we have a ton of fun together, but it is hard to get any work done when he’s in my office and wants to play! Imagine how difficult it would be to have a yoga class, for instance, if you had a few puppies running around the room. Yikes!

The 33rd Annual World Outlook Financial Conference at the Bayshore Hotel, Vancouver, February 3 & 4, 2023
Mike Campbell’s hugely popular annual conference will be back LIVE AND IN PERSON at the Bayshore Hotel after two years of Covid restrictions. Mike and his team have again created a fantastic roster of speakers and exhibitors. I’ve attended every one of these conferences, and with all the turmoil and confusion in today’s markets, I highly recommend my readers make plans to attend. Videos will be available after the conference if you can’t attend in person. You can get all the information you need here.
Listen to Victor talk about markets
I’ve had a regular weekly spot on Mike Campbell’s Moneytalks show for >22 years. The January 21 show with special guest David Yager delivering a terrific interview on energy and energy politics is available at: https://mikesmoneytalks.ca/category/mikes-content/complete-show/
I recorded my monthly 30-minute interview with Jim Goddard for “This Week In Money” on January 7. You can listen here. I talked about how I thought markets would shift from being laser-focused on the Fed – that maybe geopolitical issues would be the big driver of markets this year. We also talked about stocks and interest rates and currencies and especially gold.
The Archive
Readers can access weekly Trading Desk Notes going back five years by clicking the Good Old Stuff-Archive button on the right side of this page.
Headsupguys
I’ve had friends who took their own lives. Headsupguys is a project at the University of British Columbia that helps men deal with depression. If you or someone you know is struggling, reach out to Headsupguys. They are there to help.
Subscribe: You have free access to everything on this site. Subscribers receive an email alert when I post something new – usually 4 to 6 times a month.
Victor Adair retired from the Canadian brokerage business in 2020 after 44 years and is no longer licensed to provide investment advice. Nothing on this website is investment advice for anyone about anything.