There was a very important Key Turn Date (KTD) at the beginning of September when several different market trends all REVERSED direction at the same time. Those reversals set up the market the trends of the past 2 months. (I’ve circled the KTD in all of today’s charts.)
My trading in September and October has been in line with the market trends since the KTD…essentially I’ve been positioning for lower stock markets and a stronger USD.
The most dramatic reversals on the KTD were registered by “high flying” individual equities…but all of the major American stock indices reversed at that time following the “blow-off” top that was created by the extraordinary irrational exuberance we saw during the late stages of the summer rally.
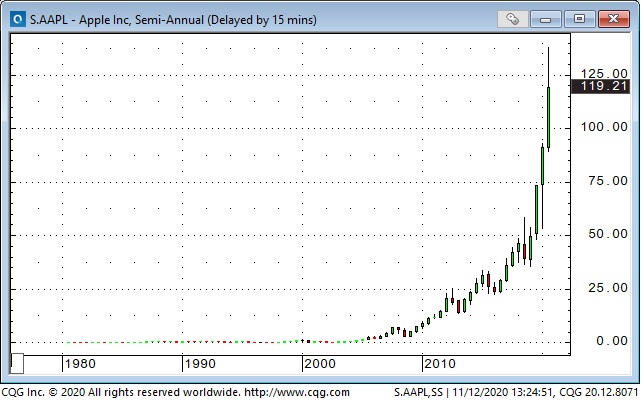

The US Dollar Index reversed higher from a 28 month low on the KTD…mirrored by the Euro turning down from a 28 month high. A number of other major currencies also reversed on that date including CAD, AUD, INR, GBP and other Euro area currencies.
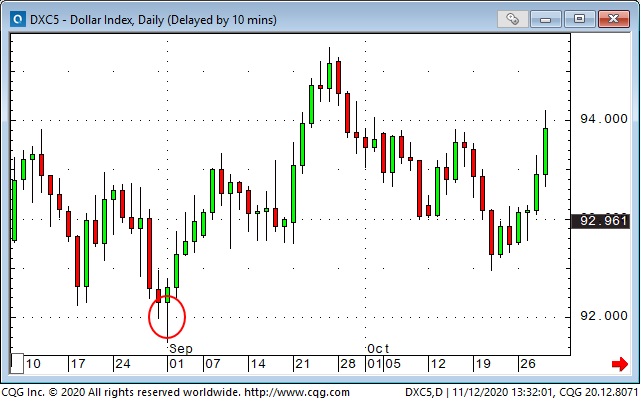


Both Gold and the US Long Bond topped out in early August but registered a “lower top” on the KTD and have drifted lower since then.

The broad CRB commodity index topped out on the KTD after recovering ~61% of its January to March decline while WTI also ended its rally off the March lows and reversed lower on the KTD.
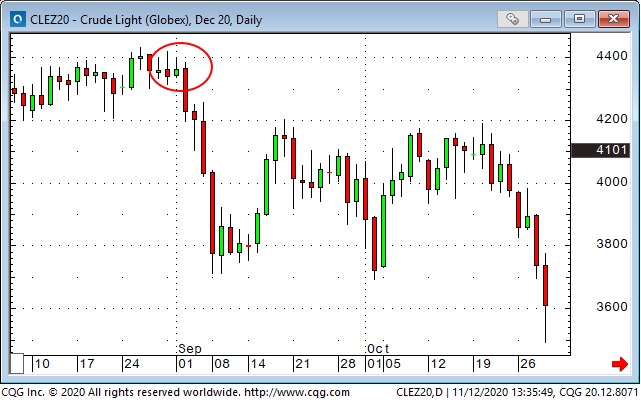

So the question is, “What caused the KTD?” My best guess is that the bullish market psychology that had been ramping up all summer simply blew out.
I’ve previously written about my bewilderment at the stock market’s “whistling past the graveyard” behavior this summer in the face of not only dramatic economic weakness but the very real prospect that it would continue. Yes, I understand the bullish impact from the stimulus…but before we go too far down the rabbit hole of trying to assign “Econ 101” rationales to market behavior let me just say this: psychology moves markets.

There are millions and millions of people trading the markets I trade. I can’t possibly know who they are, what they know, what size they’re trading, what their time horizon or risk tolerance is, or what motivates them to do what they do…but…they do leave their footprints in price action…and I make my trades based on what I see in the price action.
That doesn’t mean I don’t pay attention to the “news” or different “theories” that are circulating about why the market did what it did…or forecasts of it should do “whatever” because of what somebody did. Of course I pay attention. That’s a great way to get a sense of how the market is positioned.
For instance, if I believe speculators are positioned very bullish on the Euro but price action is starting to look bearish I will be more willing to short the Euro.
The most important thing I do with my trading is to constantly try to identify and monitor the risks I’m taking…and to have strategies in place to control those risks. I think that contributes more to my trading success than picking what to buy or sell…given that I lose money on more than half of the trades I make.
I use stops. I keep the time horizon of my trading in sync with the time horizon of my analysis. I watch out for concentration (very important in this current “all one market” environment.) I keep my size modest (see my recent Trading Life post on sizing) and I make sure no one trade is important…it’s just another trade.
But probably the most dangerous, elusive yet pervasive risk I have to deal with is my innate desire to assign some “reasonable cause” to price action…such as, “Gold went up today because traders fear that the Fed will tolerate higher inflation.”
I say that’s dangerous because it’s SO easy to be “right” (make money on a trade) for the wrong reason…and once a trader assumes he knows what’s driving prices he’s going to be more aggressive…and if he really was right for the wrong reason then he’s going to “dig in his heels” when the market goes against him…and lose WAY too much money. I don’t want to be that guy.


