
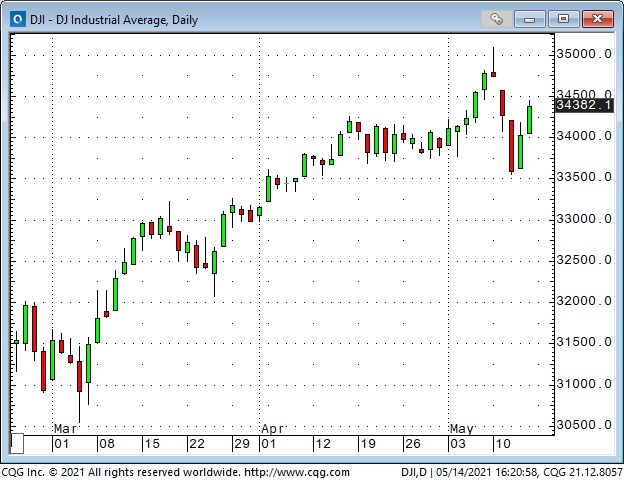
The DJIA fell ~1,500 points from Monday to Wednesday but bounced back ~900 points by Friday. In other news…
The Dow Jones and S+P futures closed at All-Time Highs Friday, May 7, traded higher during the Sunday overnight session but turned lower Monday morning and tumbled ~1,500 points to Wednesday’s lows. The DJIA rallied back ~900 points Thursday and Friday.
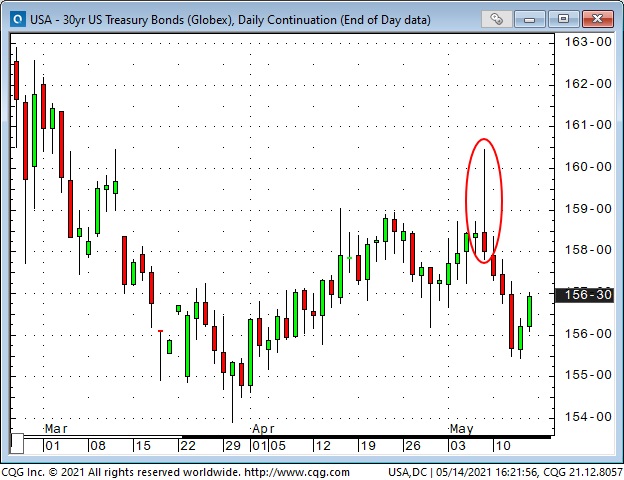
Bond futures surged on the weak employment report early Friday, May 7, but had 2nd thoughts and sold off five points into Wednesday’s lows. The tumble in stocks and bonds may have been motivated by perceptions that inflation was running hotter than expected.
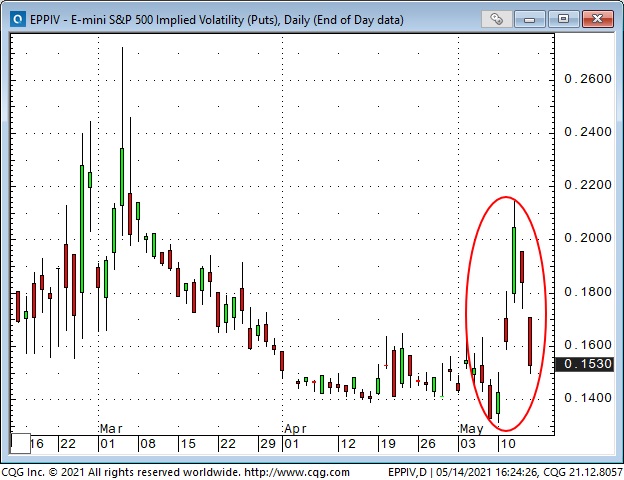
The implied volatility on S+P futures closed Friday, May 7, at a 14-month low, indicating complacency. IV spiked sharply as stocks and bonds tumbled early this week but fell back quickly when equities rallied Thursday and Friday.
Was the break from All-Time Highs the start of something, or just another BTD opportunity?
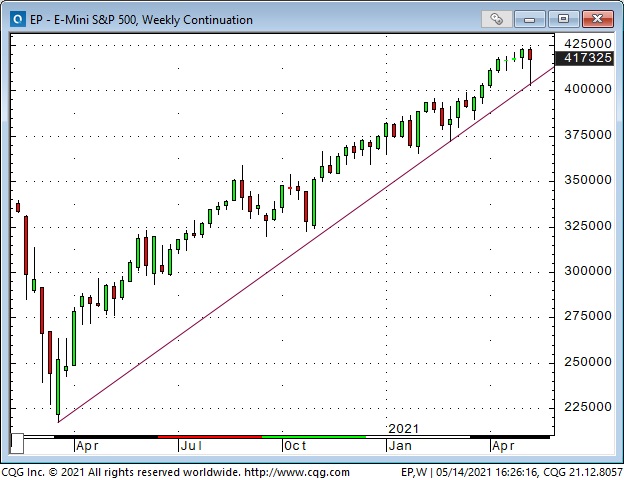
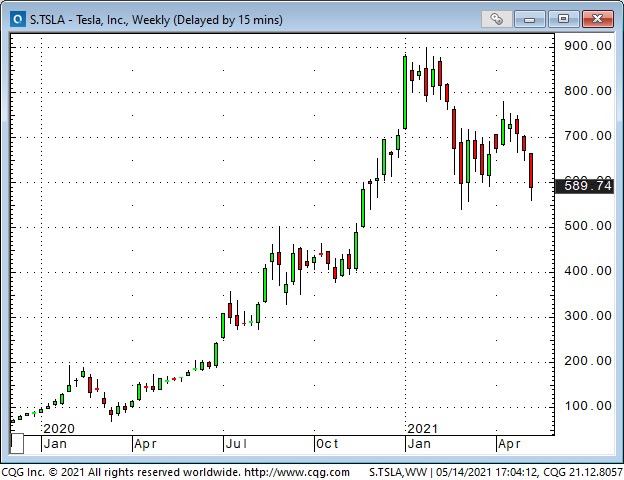
Given that economic data and Old School Valuation metrics seem to have little impact in determining current equity index levels, I will look at market psychology – price action – to answer that question. The trend clearly remains up on the weekly chart.
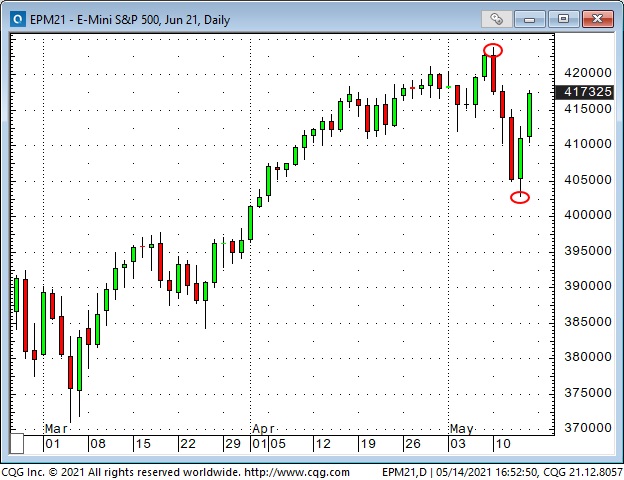
On the daily chart, the reversal will be a BTD opportunity if last week’s highs are taken out but will be an “early warning sign” if the market rolls over and drops below this week’s lows. Patience, grasshopper.
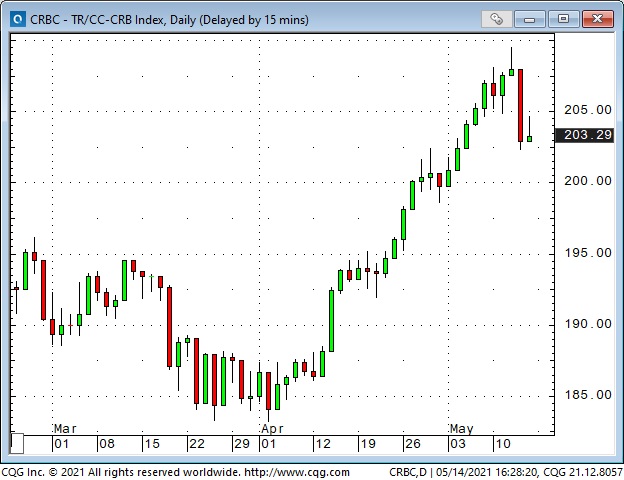
Commodity indices hit 6-year highs, then registered a sharp 2-day reversal
Commodity indices began a new bull market at last year’s lows – but the recent pace of the rally has been running too hot (just like equities), and a correction is overdue – may have started.
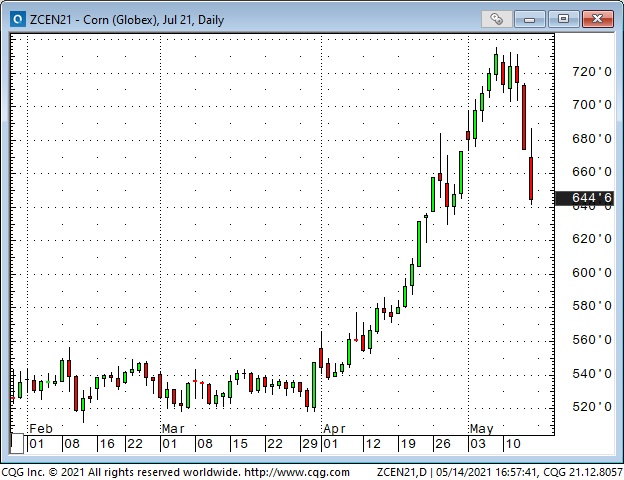
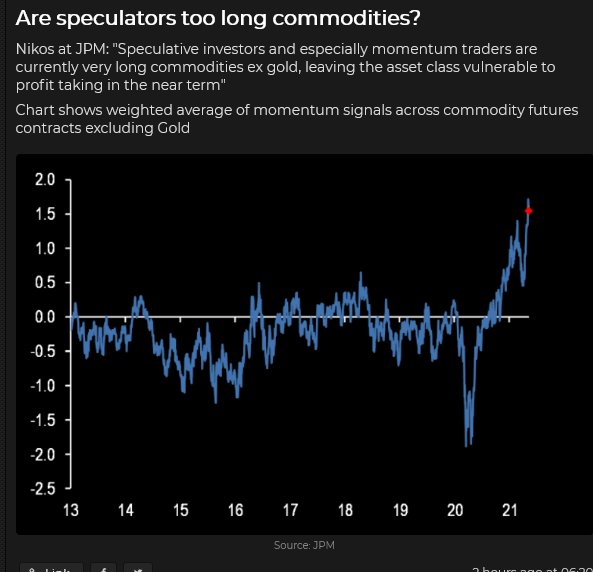
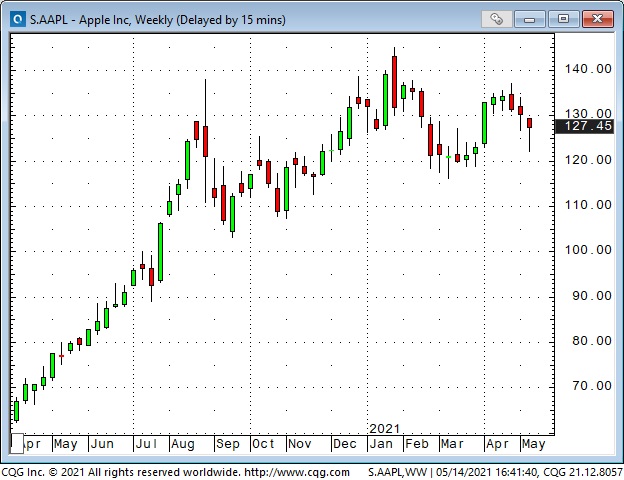
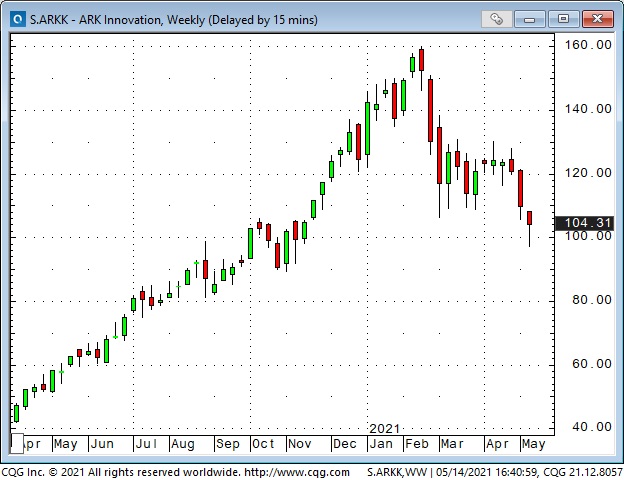
Actually, my thinking has been that “bullish enthusiasm” across asset classes – from real estate to baseball cards to crypto – has been extraordinarily reminiscent of early 2008 – and a bracing correction is likely. Some markets turned down a month or two ago from record highs, and other markets have turned lower in the last week or two. I think we are seeing both “rotations” (from mega-cap tech into less over-bought stocks, from growth to value) but also blow-offs of issues that attracted hot money – and then lost it.
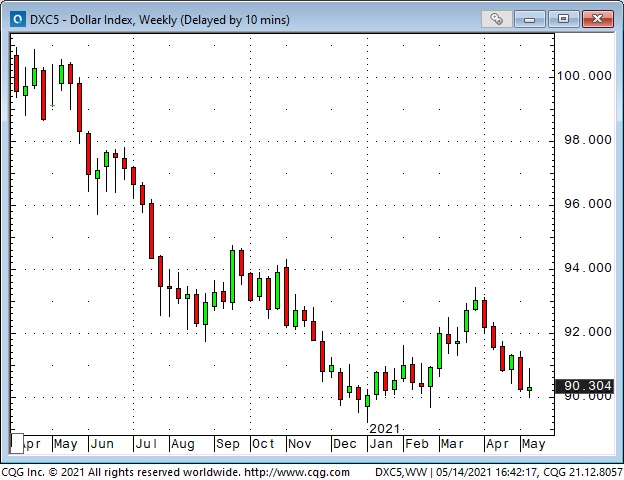
A weaker US Dollar has been part-and-parcel of the bullish enthusiasm narrative.
The US Dollar Index (USDX) has been trending lower the past 6 weeks but – no surprise – popped higher on Wednesday when both stock indices and bonds fell for the 3rd consecutive day. When stock indices and bonds rallied Thursday and Friday, the USDX traded lower.
The Canadian Dollar has been the world’s strongest currency this year
At the peak of the last commodity bull market in 2011, the CAD was ~1.05 against the USD. As commodities tumbled in a brutal bear market over the next several years, the CAD also tumbled – hitting 68 cents in January 2016, when WTI crude oil hit a 13-year low of $26.
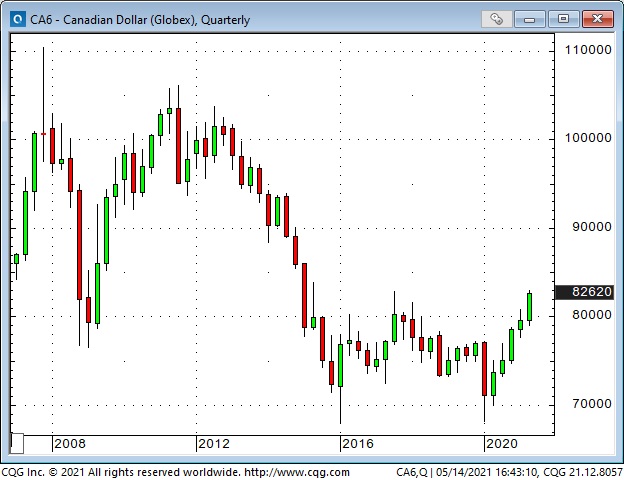
The commodity indices and the CAD rallied from the January 2016 lows but tumbled to ~17-year lows in March 2020. Since then, the CAD and the commodity indices have marched steadily higher together. This chart shows the strong correlation between the CAD and commodity indices. (The pink line is the CRB index, the black line is the CAD.)
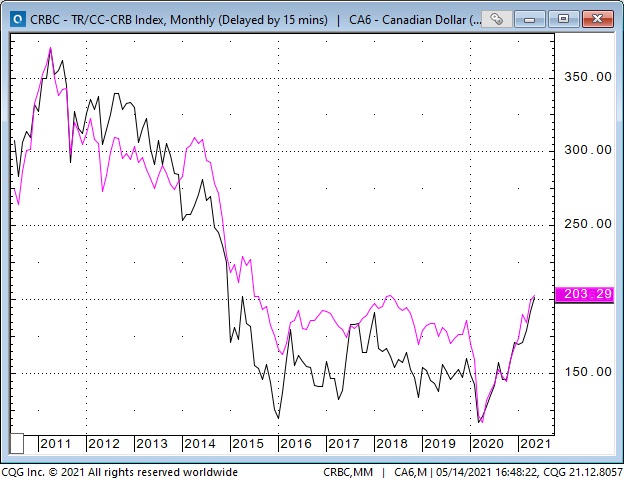
Over the past year, the CAD has also had a strong positive correlation with the S+P and a strong negative correlation with the USD. So – these three correlations created a very bullish environment for the CAD since the March 2020 lows, and the CAD has rallied from ~68 cents to ~83 cents (~22%.)
The Bank of Canada added the “cherry-on-top” in terms of bullish factors on April 21 when they surprised the market with a more hawkish-than-expected monetary policy announcement. (Circled date on the chart below.) Since that announcement, the CAD has rallied nearly 4 cents, open interest has surged ~36,000 contracts (20%), and speculative positioning has surged from flat to net long 40,000 contracts – the largest net long position in 18 months. Speculators are VERY bullish on the CAD – seeing it as a pro-risk play on the surging commodity market.
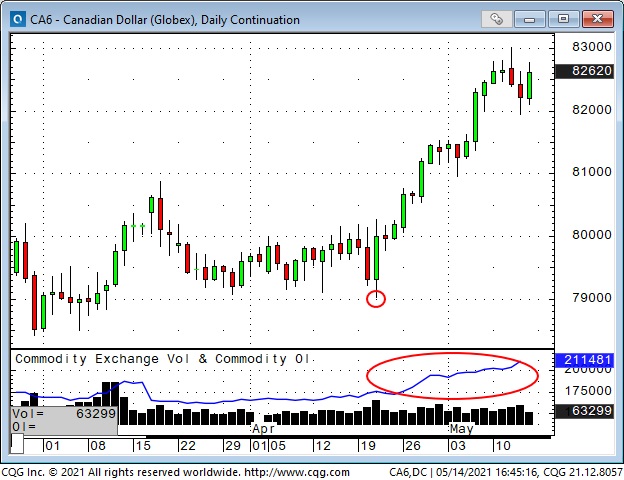
The CAD touched a 6-year high at 83 cents this week before falling 1 cent as stocks and commodities fell, and the USD rose. The CAD, like the stock indices and WTI crude oil, bounced back at the end of the week but did not make new highs.
My short term trading
Last week, in the On My Radar section, I wrote that I would be looking for a chart set-up this week to short the CAD. I liked the price action this week in the stock indices and the CAD, and I got short. I’m going into next week short 83 calls and long 82 puts. If the CAD closes at a new high, I’ll cover my positions for small losses – if the CAD takes out this week’s lows, I’ll try to add to my short CAD positioning.
I shorted the Russell on Monday’s day-session opening and again on Tuesday, covering on Wednesday. I re-shorted the Russell Thursday but was stopped early Friday. I’m flat stock indices into the weekend.
I took profits on the bearish WTI crude oil time spread I established last week.
On My Radar
This week’s price action in stock and commodity indices and the CAD creates a great setup for next week. Buy new highs, sell a break of this week’s lows.
Thoughts on Trading
Keeping the time frame of your trading in sync with the time frame of your analysis is essential – for instance, don’t put on a trade based upon your analysis of a daily chart and then, if the trade goes against you, justify staying with it based upon your analysis of a weekly chart.
I think it’s ok to have different time frames for different trades – as long as you are clear about the time frame before you initiate each trade. But have you discovered what time frame generally works best for you?
I have no interest in trading in and out of a market in a matter of moments or minutes – I don’t have an edge in that time frame – but I understand that’s a perfect time frame for some people. At the other end of the time scale, I have no interest in taking a position that I will maintain – come hell or high water – for at least a year because I “know” I’m going to be proven right.
After years of trial and error, I’ve discovered that my ideal time frame for short-term trading is a few days to a few weeks. If I close out a position the same day I put it on, it will almost always be a losing trade.
Another aspect of “time frame” is being willing to wait for the right time to initiate a trade, or to add to a trade. Think of it this way: if a friend tells you he is making money on a stock, should you immediately buy some?
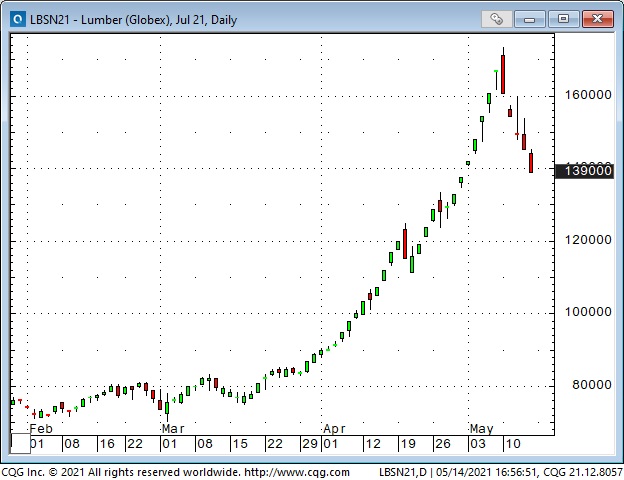
Another essential aspect of trading is to find out how much money you can “afford” to lose on a trade. By “afford,” I mean both the impact on your P+L and the impact on your “mental capital.” Finding this number will help determine your time frame, the markets you choose to trade, and the sizing of your trades. For instance, It would be out-of-the-question for me to even think about shorting ten cars of lumber at a limit up and then keep putting up margin money while I waited to be right on the trade. There may be someone in the world ready to make that trade, but it certainly isn’t me!
I think of trading as a process that involves making an ongoing series of trades – no individual trade within that series is more special than any other trade. For example, if I typically risk less than 1% of my trading capital on a trade, I will not suddenly put on a trade where I’m willing to bet 10% of my account because I know my latest brainwave is a sure thing!
For me, trading is a grinding marathon – net profits over time come from managing risk rather than having brilliant insights!
Subscribe: You have free access to everything on this site. Subscribers receive an email alert when I post something new – usually 4 to 6 times a month.
Victor Adair retired from the Canadian brokerage business in 2020 after 44 years and is no longer licensed to provide investment advice. Therefore, this blog, and everything else on this website, is not intended to be investment advice for anyone about anything.