Choppy price action in mid-summer markets
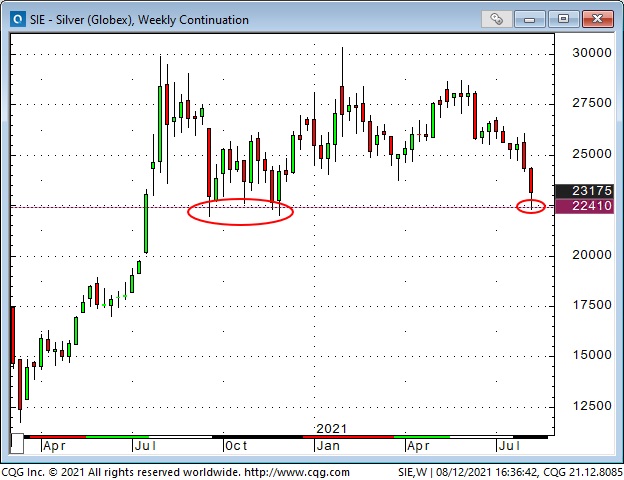
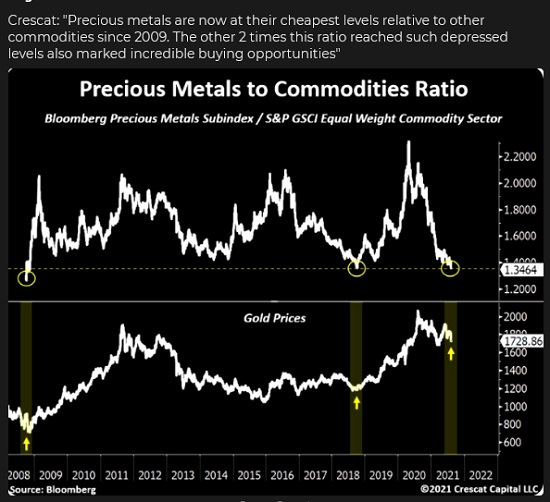
Gold and silver fell sharply Friday of last week (August 6th) as the US Dollar surged higher following the much-stronger-than-expected US employment report. But the real fireworks happened when markets opened in the Far East on Sunday afternoon, August 8th. Gold tumbled ~$85 from Friday’s closing levels, while silver dropped ~$2. Both markets recovered most of those losses over the next several hours.
In both of these charts the first elipse is Friday after the employment report, the 2nd elipse is the Sunday afternoon reopening.
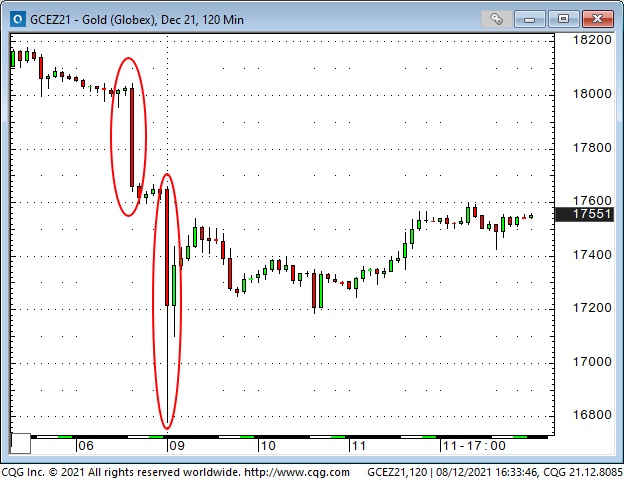
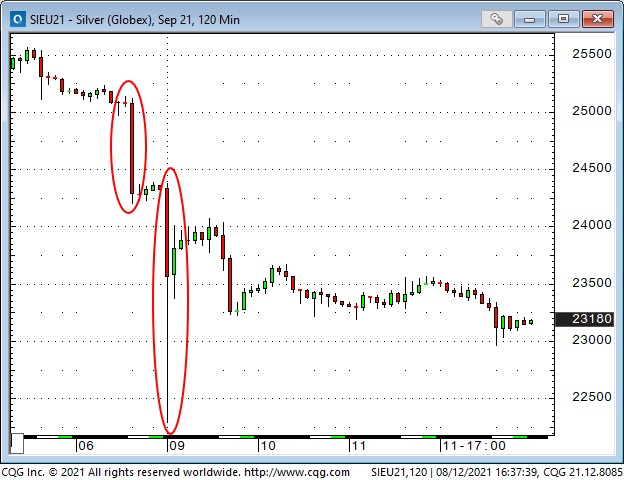
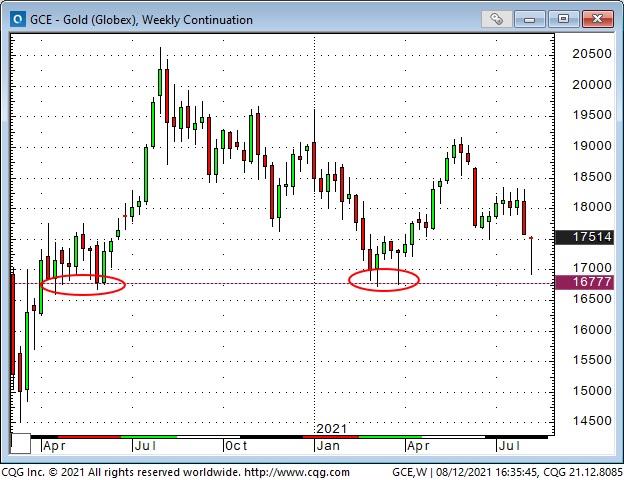
There were reports of heavy selling into thin market conditions as soon as markets opened Sunday afternoon (North Amereican time.) The most likely rationale for this heavy selling was a “margin clerk” hitting any bid in an attempt to liquidate an account that Friday’s sell-off had crippled. Whatever the reason, gold fell >$150 from last week’s high to Monday’s low. Silver was down >$3.75 (14%) in the same time period.
Gold bulls may find some solace in the fact that the March lows around $1,675 were not breached in the Friday/Monday sell-off. However, silver bulls will be less sanguine as the white metal made new lows for the year.
Is the 4-month bond rally over?
In March/April, the consensus view was that bond yields would rally for the rest of the year as inflation heated up. However, bond yields fell (bond prices rose) from May through July as stocks, commodities, and the USD also rose.
The bond chart made a double-top in July / early August, and the 3-month uptrend was definitely broken last Friday as bond prices tumbled on the strong employment report.
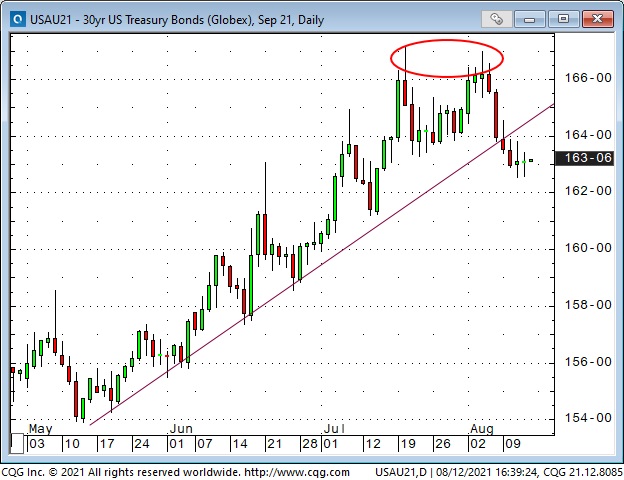
Year-over-year inflation reports continue to run hot, Democrats in Washington want to spend more and more trillions, and the Fed will start talking about “tapering” their bond purchases. Bond bulls might get queasy.
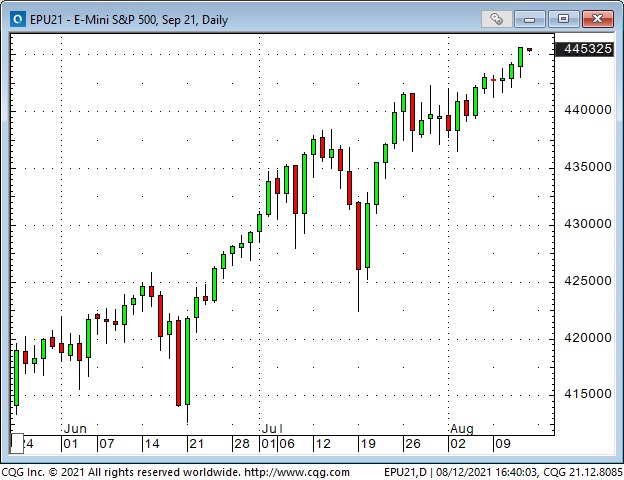
Another week – another set of new All-Time Highs for stock indices
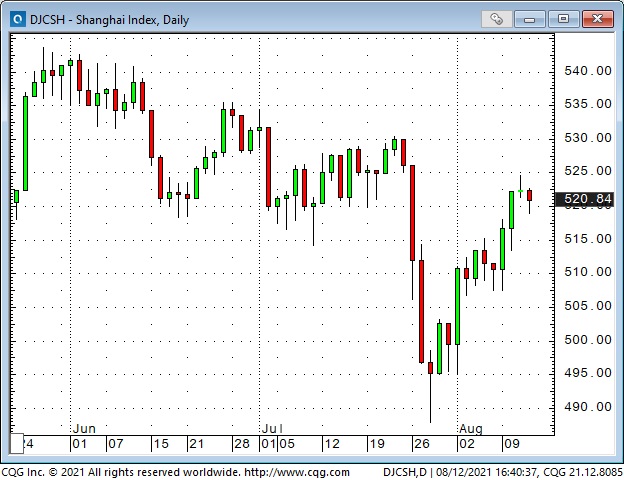
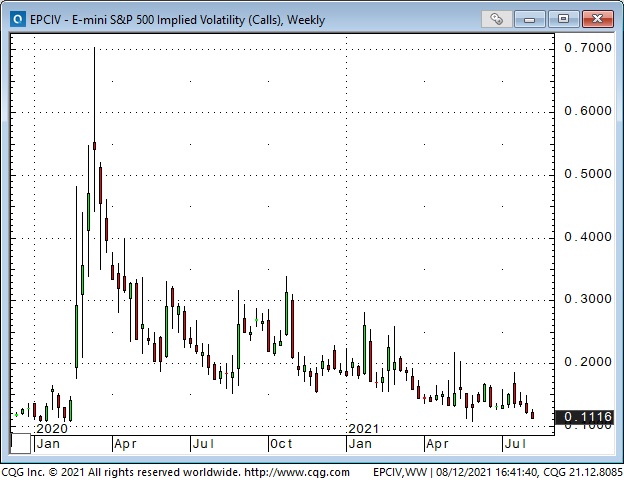
The leading North American and European stock indices continue to grind higher in low-volume summer trade. Even the Chinese indices (ex-tech) have bounced back after their sharp sell-off three weeks ago. Implied volatility on the S+P futures has dropped to a new 17-month low.
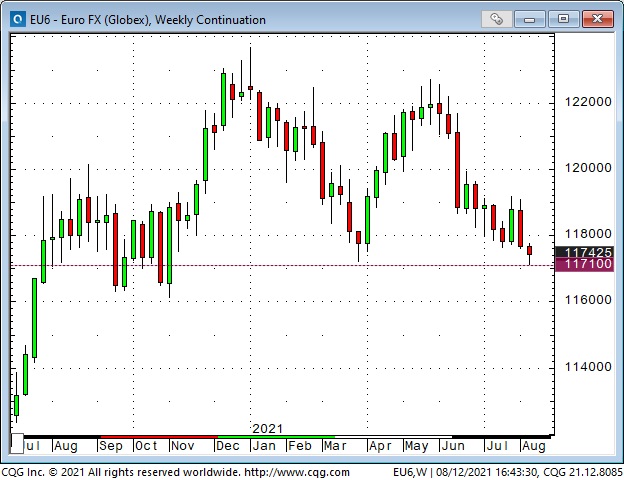
The US Dollar remains firm against most currencies – the Euro has made new lows for the year
The US Dollar Index fell to nearly a 3-year low when the Capital Building was stormed on January 6th. In my January 9th and 16th Notes, I called that low a “cathartic inflection point.” The USDX is now ~4.5% above that nadir.
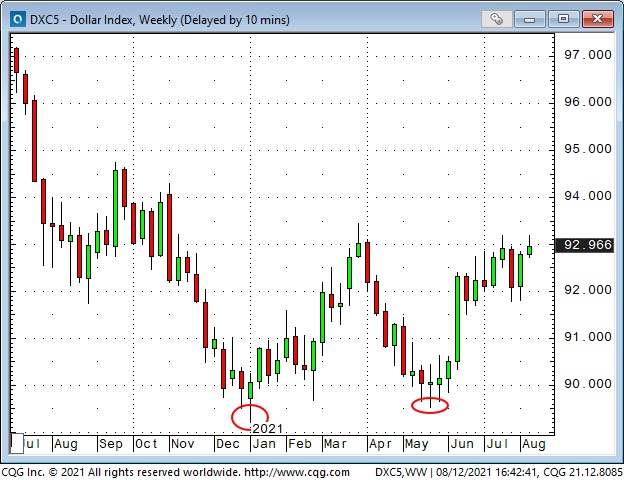
The United States seems to be swamped by so many problems, yet in the world of currency trading, we trade the USD against the currencies of other countries. Seeing the USD strong against nearly all other currencies implies (to use a lovely old chestnut) that America is the cleanest dirty shirt in the laundry hamper.
The Canadian Dollar – finding its footing after a 5-cent sell-off?
The CAD hit a 68-cent low during the Covid panic in March 2020 and then began a plodding rally back to the 80-cent level by March/April 2021. During that rally, the CAD became a bit of a “darling” in the hedge fund world – perhaps due to its high positive correlation with commodities over the past 20 years.
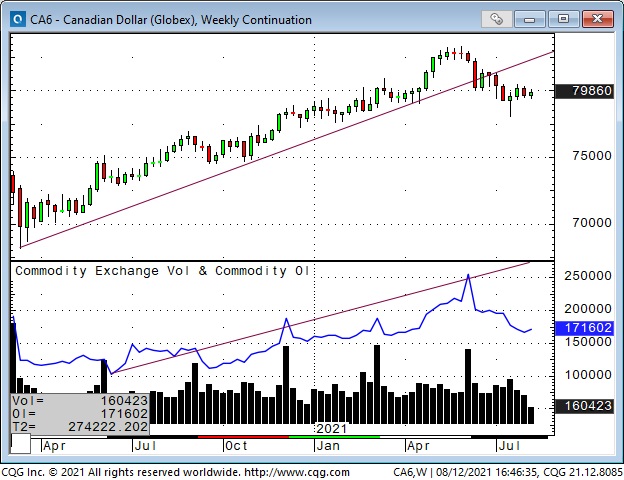
I say a bit of a “darling” because speculators built a substantial net long position in CAD futures during that 12-month rally. The “cherry on top” for the CAD was the run from ~80-cents to ~83-cents from late April until early June. Speculators doubled down on their bullish positioning by adding to their net long position as the CAD fell away from the 83-cent level as June progressed.
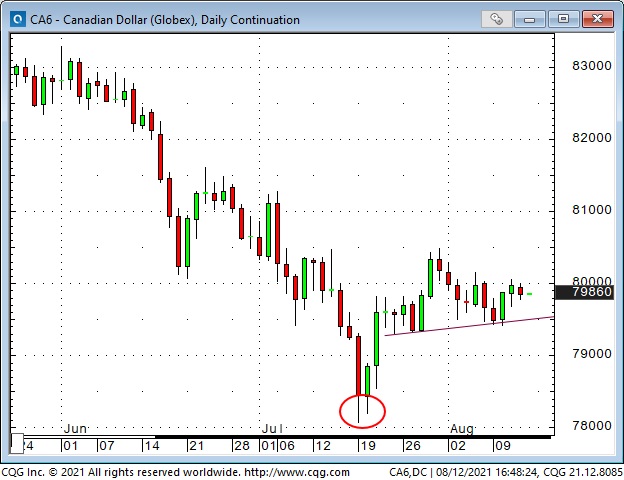
It was a classic example of “Buy The Dip” thinking; however, in this case, it turned out to be more like “Making a bad situation worse,” as the CAD continued to fall and bullish speculators began liquidating their positions. In three weeks, the CAD fell more than 3-cents to 78 cents as the selling intensified. Once the bullish positions were “blown out,” the CAD rallied to the 80 cent area.
Crude oil: a shifting supply/demand picture
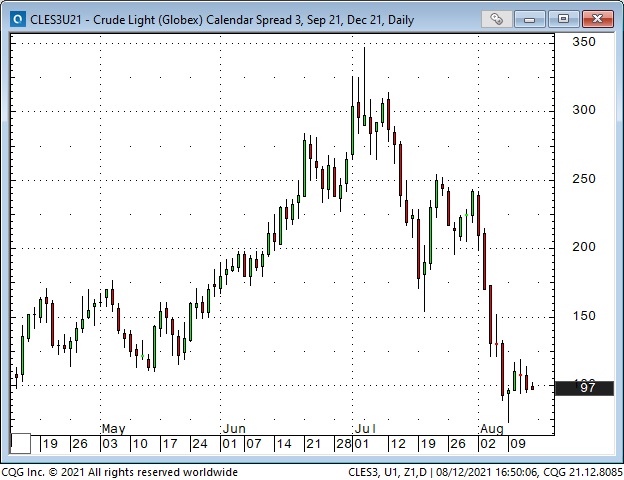
Front-month WTI traded briefly above $75 in early July, with the consensus view being that global demand was surging even as OPEC+ was slow to ramp up production. OPEC+ then set a timetable for production increases through the end of the year, but the market started to focus on weakening demand in the face of rising Delta infections – and WTI prices dropped. (Similar to the CAD situation described above, speculators had built substantial net long positions as WTI rallied, and the sharp drop in prices may have been exacerbated by spec selling.)
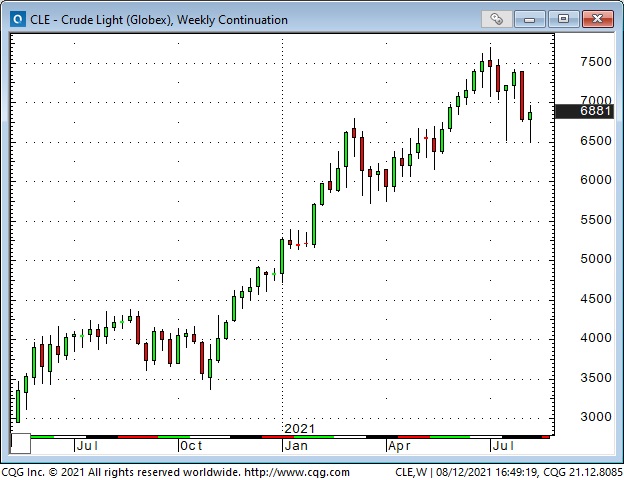
WTI surged higher from late May to early July, with the premiums of front-month crude rising sharply over the deferred months. This surge in the time spreads may have indicated a demand for WTI “right now,” but may also have indicated that speculators (who usually concentrate their buying in nearby months) may have been aggressively adding to their bullish positions. Whatever the cause, the front-month time spreads have collapsed since the July highs.
My short term trading
Since last week, I’ve been in “summer holiday” mode, and given the low-volume markets, it looks like I’m not the only one! I’ve had visitors and travel commitments, so I’ve cut “way back” on my short-term trading. As of Thursday, August 12th, the only trade I have on is long the CAD with short calls written against the position.
On my radar
I’m taking a break during the slow summer season, but I’m concerned that markets could get intense this fall. The Delta variant seems to be spreading rapidly, American political wrangling may get ugly, stocks seem increasingly at risk of a correction, the Fed may make a move, the inflation/deflation/stagflation debate may appear to have a clear winner – and then there’s always geopolitical concerns.
I can’t tell you how many times I’ve seen markets drift through late summer only to come back with a bang after Labor Day.
Thoughts on trading
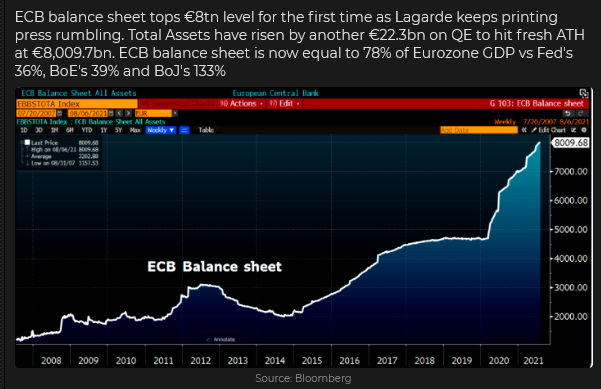
There seems to be an obvious positive correlation between rising Central Bank balance sheets and rising stock indices, just as there has been a strong positive correlation for the last forty years between falling interest rates and rising stock indices.
But Central Banks (ex-Japan) don’t buy stocks directly. People do, and with interest rates so low and with stocks continuing to rally, it’s no wonder that FOMO is a great motivator.
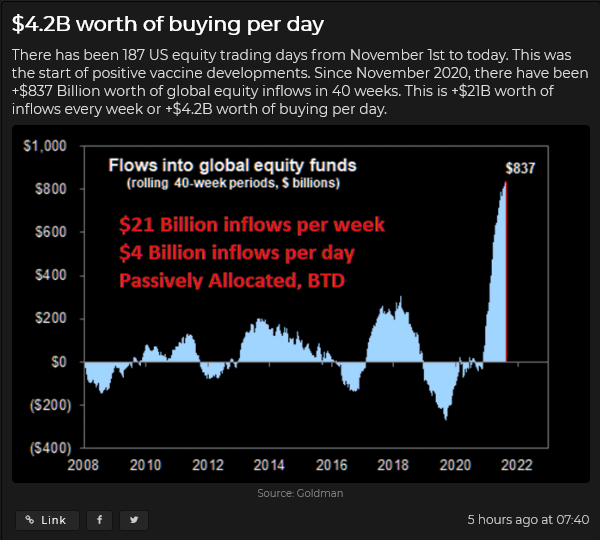
I frequently see charts picturing the trillions of dollars of “cash on the sidelines.” I think the point of these charts is that someday, those people who are wasting their time and missing great opportunities will “get with the program” and move that cash into the stock markets, which means the major indices will go a lot higher.
Maybe, maybe not. I think that cash is on the sidelines for a good reason. I think a lot of seasoned market participants want to have exposure to the markets, but they think it’s wise not to be “all in.” Think of Buffet with ~$140 billion, or ~30% of Berkshire’s total assets in “cash.” Do you think he’s going to have a FOMO attack and suddenly start buying shares? I don’t. Buffet says that the stock market is a device for transferring money from the impatient to the patient.
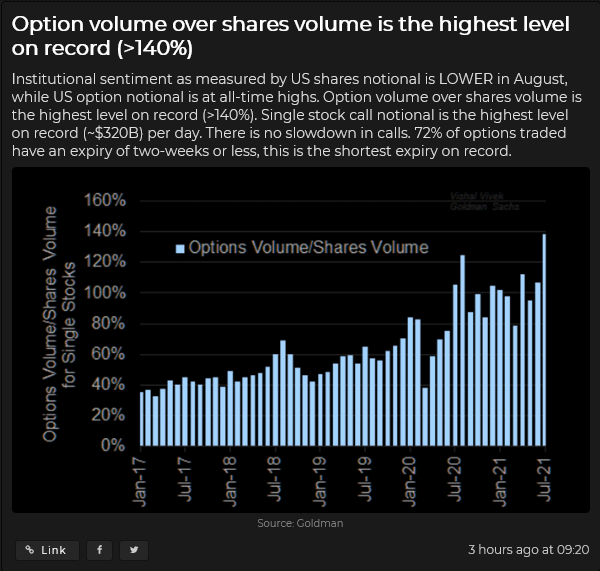
Once again, it comes down to time horizons. People get caught up in the moment and forget about “mean reversion” at their peril. Here’s a link to a great article (written by my friends at Real Investment Advice) that asks (and then answers) the question: What would Bob Farrell do? I recommend it to you!
Subscribe: You have free access to everything on this site. Subscribers receive an email alert when I post something new – usually 4 to 6 times a month.
Victor Adair retired from the Canadian brokerage business in 2020 after 44 years and is no longer licensed to provide investment advice. Therefore, this blog, and everything else on this website, is not intended to be investment advice for anyone about anything.


