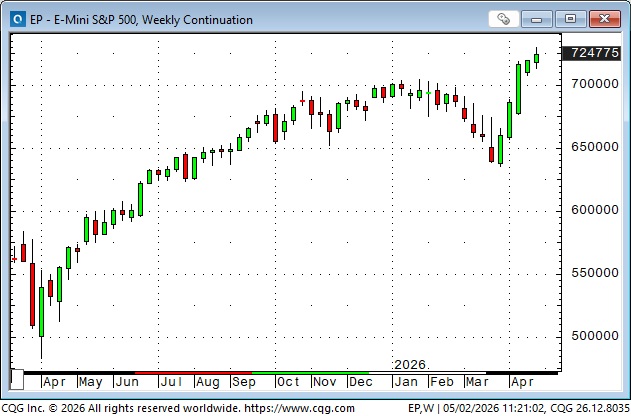
The soaring tech sector had pulled the S&P and Nasdaq indices to new all-time highs
S&P futures have closed higher for five consecutive weeks, after closing lower for five consecutive weeks in February/March. The top 10 stocks in the S&P have accounted for ~75% of the index gains since the March lows.
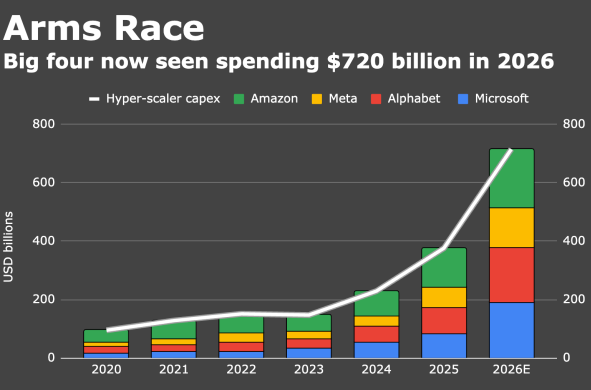
As this chart from the FT illustrates, Big Tech continues to “blow away” the rest of the market.
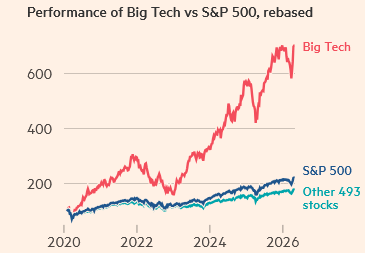
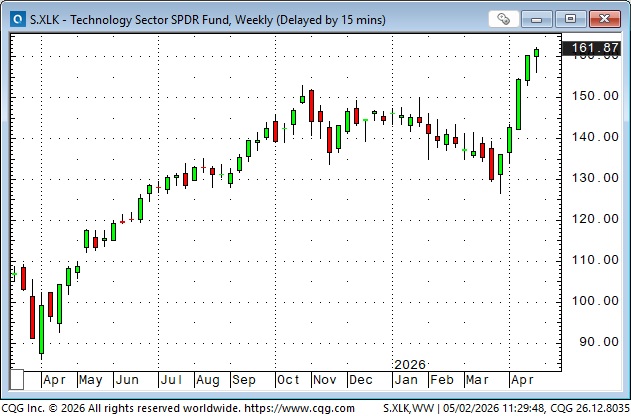
XLK, the tech sector ETF, is up ~29% from the March lows; the S&P is up ~14%.
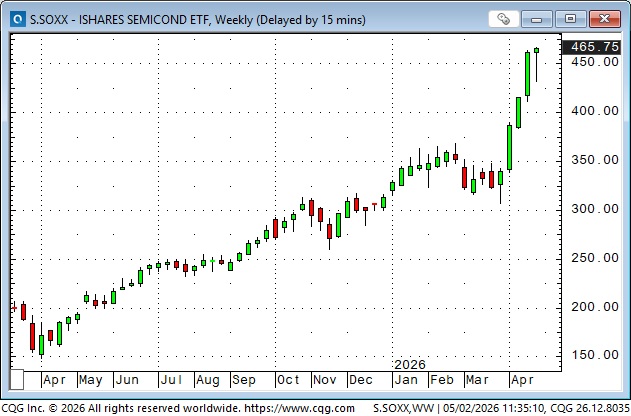
SOXX, the semiconductor ETF, is up ~52% from the March lows.
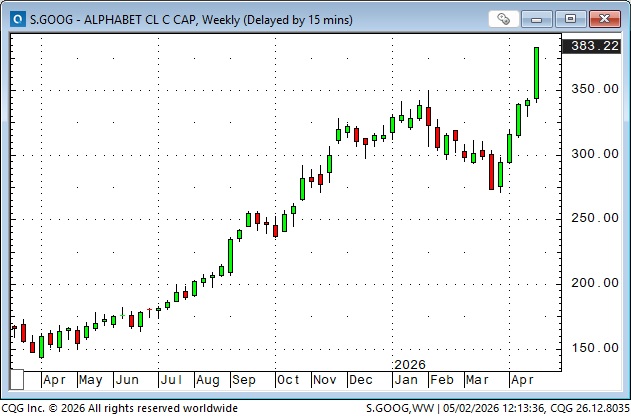
GOOG’s share price is up ~41% from the March lows, with 36% of those gains coming this week on a strong quarterly report.
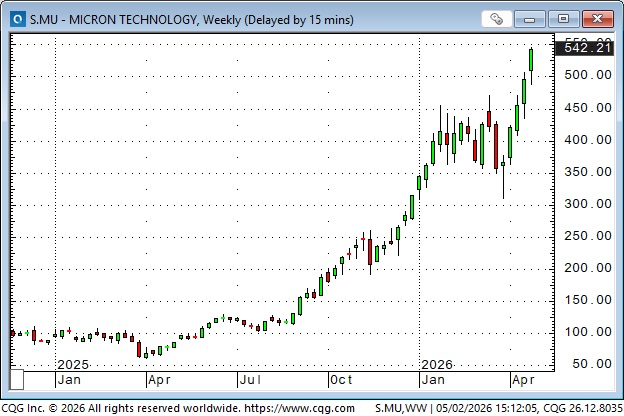
And then there’s Micron, up 10X from its April 2025 lows and ~75% in the last five weeks.
The US tech sector is spending a lot of money, which is having a stimulative impact across the economy. The American equity market accounts for ~65% of the global market cap.
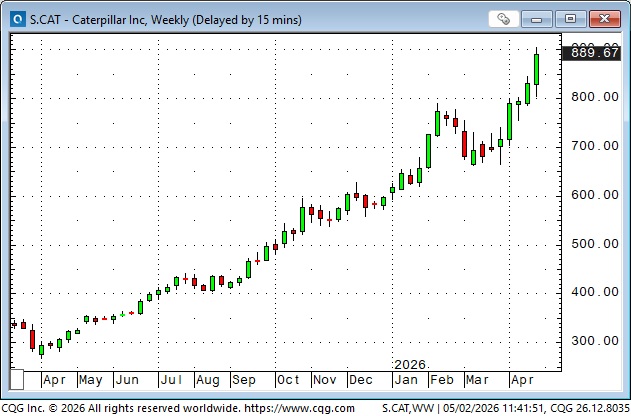
CAT share prices are up 3X from the April 2025 lows and up ~34% over the last five weeks.
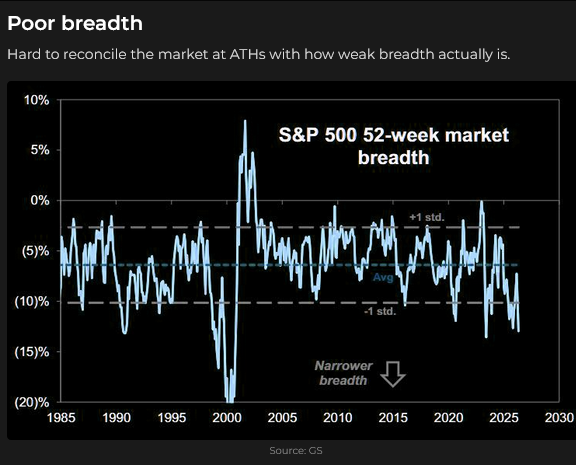
The dominance of the tech sector has led to weak breadth in the S&P.
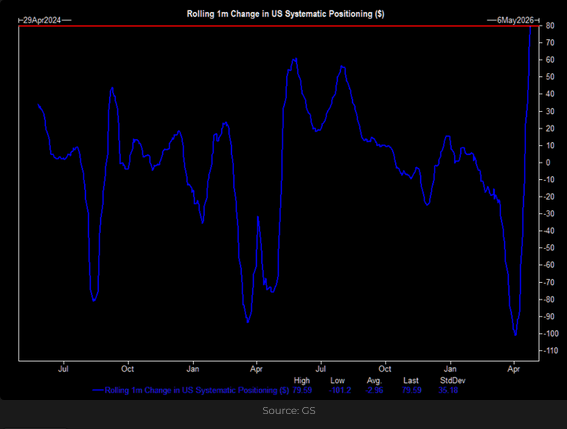
A rising market attracts buyers. Systematic accounts (for instance) were net sellers as stock markets fell in March and then became aggressive buyers as prices rose in April. Say it again: a rising market attracts buyers.
Quarterly earnings reports have mostly been stronger than expected (funny how that happens) with ~46% of the S&P companies reporting so far, representing ~80% of market cap.
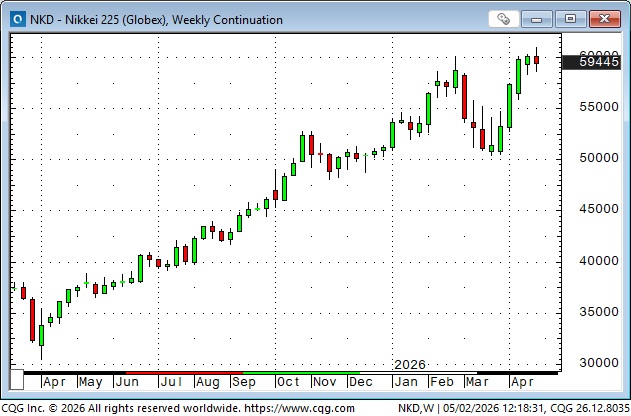
Japanese Nikkei futures hit a record high this week.
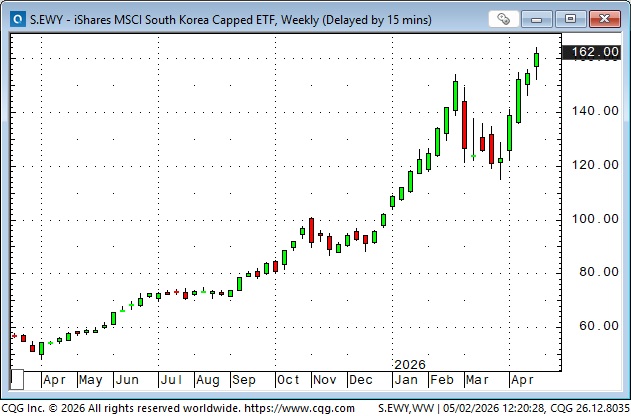
EWY, the ETF for Korea, also hit a record high this week.

As did the EEM, the ETF for emerging markets.
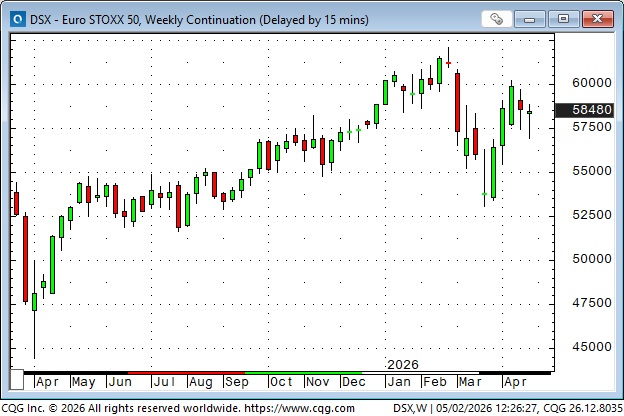
The Euro Stoxx 50 futures have rallied from the March lows, but have not made new highs.
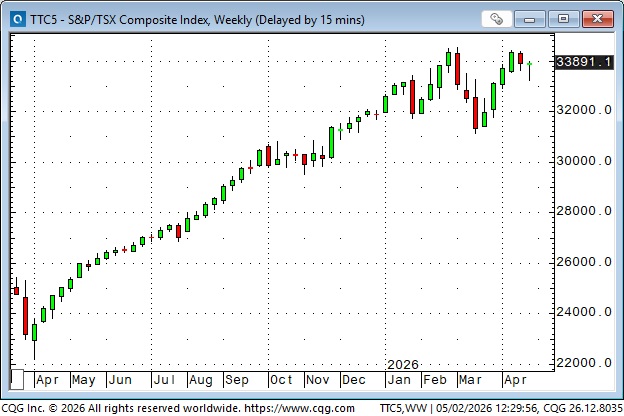
The Toronto Composite has also rallied from the March lows without making new highs.
The leading global stock indices had strong rallies in April despite the Mexican standoff over Hormuz and higher energy prices
Front-month Brent crude futures hit a 4-year high this week of ~$126, but backed off Thursday/Friday to close the week below $110.
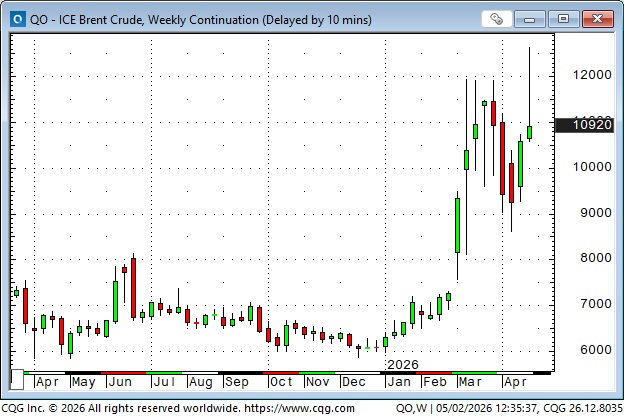
Crude oil prices rose by ~100% from their January lows (product prices are up even more) as the energy market becomes increasingly sensitive to dwindling inventories, which will lead to rationing across supply chains if Hormuz remains closed. Gasoline prices in parts of California were above $6 this week. The national average price is ~$4.43. US gasoline stocks are at 10-year lows as “driving season” starts in May.
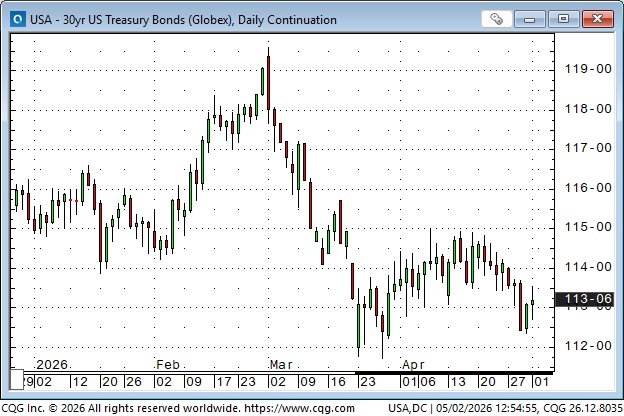
Stock and bond markets (understandably) fell in March as the US and Israel engaged in a “shooting war” with Iran. The leading stock indices began to rally near the end of March and have gone on to make new record highs in April, while the bond market had a half-hearted rally that didn’t last. (Higher energy prices = higher inflation = higher bond yields).
When the equity markets began to rally at the end of March, I thought it was a “bear market rally”. When the rally continued into the first half of April, I thought it could be “justified” (to some extent) by the softness in the oil market as front-month WTI fell from ~$118 to nearly $80, a 32% decline. (Blue ellipse).
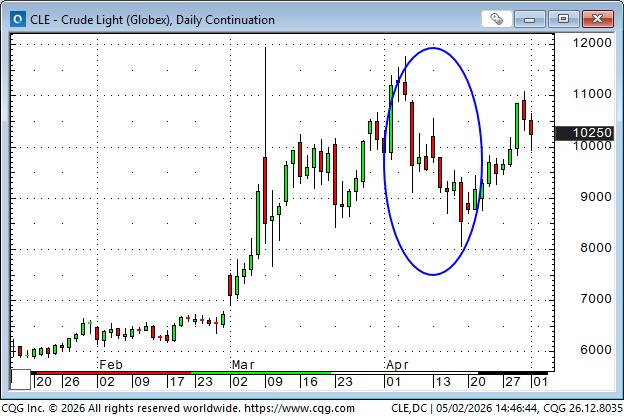
But in the 2nd half of April, as WTI rallied back above $100, the stock indices continued to rise, hitting new record highs. I wondered why that could be happening. It seemed as though, despite all the “evidence” to the contrary, equities expected diplomacy to prevail and the war to end without serious damage to supply chains or the global economy.
Alternatively, the stock market may have assumed that an energy “supply shock” could be a problem for Europe and Asia, but with North America a net exporter of petroleum products, it might be a net “benefit” for our economies. (Clearly, an energy supply shock would be more of a problem if the US were a net importer of petroleum products, like it was in earlier energy crises).
Another view is that a shortage of physical petroleum products is already “priced in” with prices double (or more) what they were in January. I wouldn’t make that bet. If Hormuz remains effectively closed and rationing begins, prices will rise further.
Either way, as the equity market continued to rally in April, buyers became increasingly aggressive, especially in the tech sector. They ignored the war; their focus was on earnings and the “golden age” of AI. (And, as everybody knows, buying dips in the stock market is a proven way to make money!)
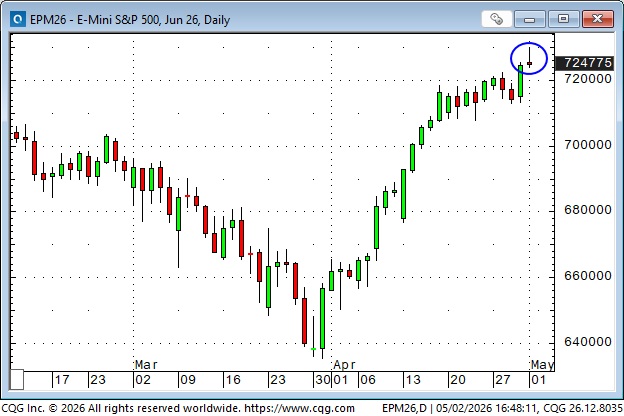
I’ve been cautiously short the S&P a few times in the last two weeks, and I’ve lost a little money. I’d rather be a seller than a buyer here, and while I’m flat going into the weekend, Friday’s price action (blue ellipse) looked like even the bulls were getting nervous.
Currencies
The Japanese authorities intervened this week, buying the Yen when it fell to near its lowest level in three decades (blue ellipse). There was “talk” that they had also shorted the crude oil market, but I haven’t seen that officially confirmed. (And even if they did buy crude oil futures, they may never confirm that they did. It would “make sense” given that a weak Yen and soaring crude oil prices are a “double-wammy” for Japan, and since they intervene, in a BIG way, in their bond market, and now the currency market, why not also hit the oil market?)
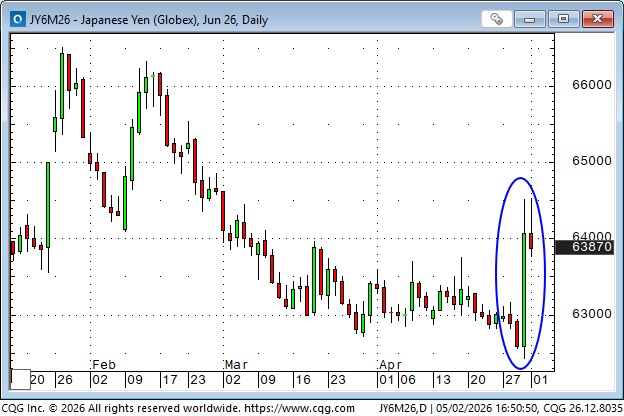
This week’s intervention levels are about the same as those in 2024, when they intervened. I think currency traders now understand that there is little to be gained, and possibly a lot to lose by shorting the Yen at these levels, but will the Yen rally persist as it did in 2024? (Blue ellipse).
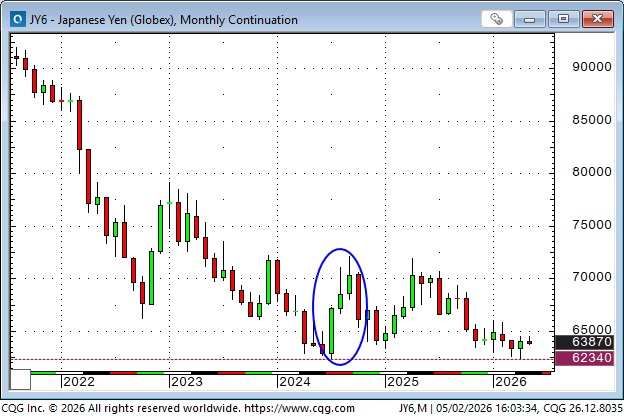
The Yen has fallen against virtually every other major currency since 2020, and would likely be much weaker without the threat of intervention. The BOJ has aggressively purchased Japanese government bonds (JGBs) as part of its quantitative easing program, now owns over half of all outstanding JGBs, and continues to buy more. Real interest rates are negative at the short end of the curve, with the policy rate at 0.75% and inflation at ~3%. Japan runs a trade surplus with the US but a larger trade deficit with the rest of the world, resulting in a persistent net trade deficit. Japan also runs fiscal deficits, and with the BOJ keeping bond yields artificially low, the weak Yen serves as the “pressure valve.” Can Takaichi turn Japan around with her super-majority government?
My short-term trading
As noted above, I shorted the S&P a couple of times this week, and was money ahead each time, but I closed the trades for slight losses. I believe the trend is your friend, up to a point, but when my intuition tells me that people think jumping on an over-extended trend is “easy money,” I’m willing to take the other side of their trade. The “win-rate” of doing that is less than 50%, but my experience tells me that the “asymmetrical risk/reward ratio” is attractive.
I bought the Yen on Monday when the BoJ sounded a little hawkish, but there was no follow-through, so I covered the trade for a tiny loss and was happy to have done so when the Yen broke to new lows on Wednesday. I missed the 200-point rally when the Japanese authorities intervened during the Wednesday overnight session while I was asleep.
I was flat going into the weekend.
On my radar
The UK has a May Day holiday on Monday, and Asia is half-closed for the Golden Week holidays.
Trump goes to China on May 14 and 15.
Thoughts on Trading
In the early 1970s, I worked for an engineering firm that provided consulting services to mining companies. I mostly did grunt work out in the mountains, but on one occasion, I accompanied the head engineer to Toronto to meet clients. During a meeting with a notorious stock promoter, we were invited to go down the hall to see a “silver trading business” he was financing.
We went into a small office. The air was blue with cigarette smoke, and there must have been 20 telephones on one big desk, with two guys who looked like rock musicians sitting across from each other, each with two telephones held to their ears, yelling at each other.
They were arbing the difference between silver traded in New York in US dollars and silver traded in London in British Pounds. The walls were covered with price charts, a Telex machine was clacking loudly, and a Reuters printer was banging away like a miniature machine gun. I looked at the tape coming out of the Reuters printer – it was providing the price of greased wool in Australia!
I was mesmerized. I had never seen anything like this. I knew this was what I wanted to do, and a couple of years later, after losing my shirt trying to sell gold bars at $150 an ounce, I became a commodity broker.
Video of the week
The Barney report
When I say Barney loves sticks, and the bigger the better, I’m not kidding!

The Moneytalks show
I hosted the podcast this week while Mike was away. My first guest, Jon Vialoux, is the founder of EquityClock, and we discussed how he uses seasonality to trade markets. Ozzy Jurock explained why different real estate assets in the same area often exhibit different price trends. Grant Longhurst landed a direct hit on the Federal Liberal government over their proposed Sovereign Wealth Fund, and Rob Levy and I had a great discussion about the major markets we trade. You can listen to the show here.

The Archive
Readers can access any of the weekly Trading Desk Notes from the past six years by clicking here.
Subscribe: You have free access to everything on this site. Subscribers receive an email alert when I post new content, typically four to six times a month.
Victor Adair retired from the Canadian brokerage business in 2020 after 44 years and is no longer licensed to provide investment advice. Nothing on this website is investment advice for anyone about anything.