Weekly change: Gold up, bond yields up, crude oil up, stocks down, USD down
Gold
Gold rallied ~$185 from 8-month lows on October 6 to this Friday’s highs, with the front-month contract closing this week above $1980 for the first time since the mid-July Key Turn Date.

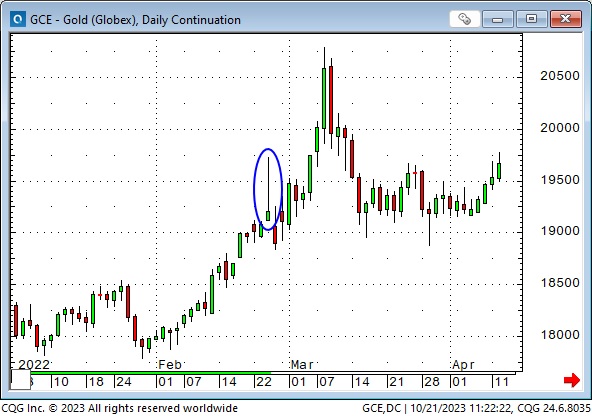
Following the Russian invasion of Ukraine on February 24, 2022, gold rallied ~$150 in nine trading days to an All-Time High of ~$2079. Within six days, all of those gains were surrendered.
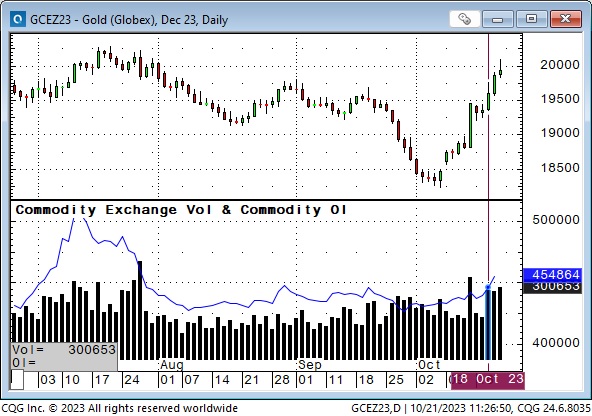
Open interest in Comex gold futures has increased only ~5% since the October 6 lows, with most of that increase happening late this week as gold rallied from ~$1935 to over $2,000. Speculators may have “jumped into gold” late in this rally (note the volume bars for the last three days.)
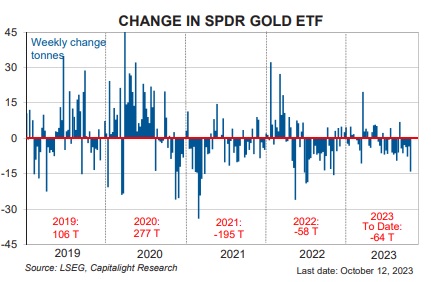
The latest data (up to Thursday, October 12) on the SPDR gold ETF shows the most net selling of any week this year. (I would be shocked if the next week’s data, up to October 19, did not show net buying.) Chart courtesy of Martin Murenbeeld – The Gold Monitor.
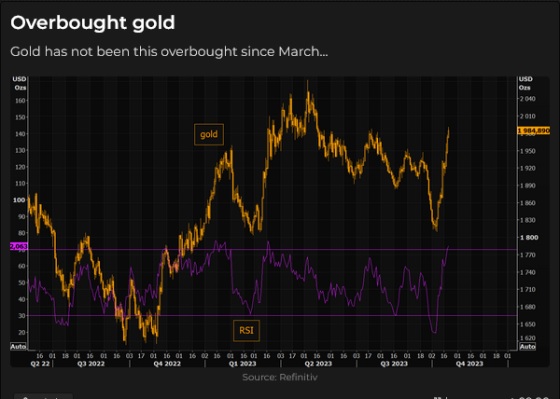
RSI shows gold to be the most “overbought” since March.
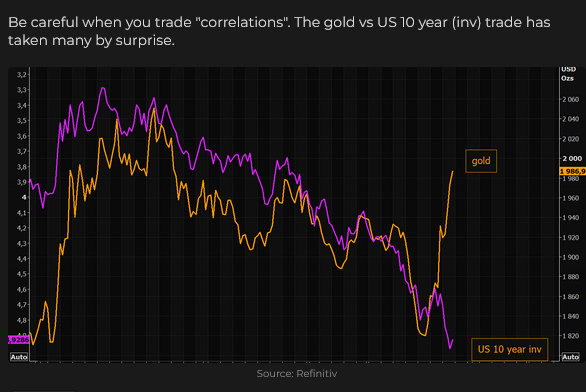
Comex gold made an All-Time High (very briefly) on May 4 this year and then trended lower into early October as bond yields and the USD rose. The negative correlation with bonds broke down following the Hamas attack on Israel – gold prices rallied while bond yields continued to rise. (In this chart, the purple line is the yield on the 10-year, inverted.) If there is any indication of Mid-East “stress” being reduced, gold prices may fall. Gold has a history of “spiking” on geopolitical crises and then backing off. If “stress” in the Middle East intensifies, the gold price will likely continue rising.
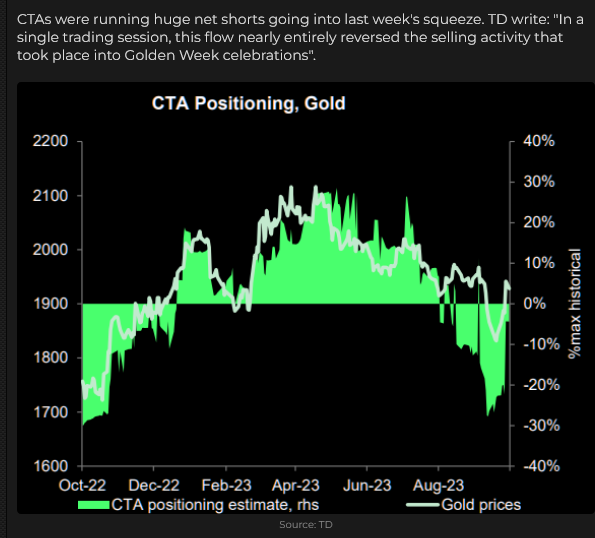
Commodity Trading Advisors (CTAs) manage substantial pools of money and are generally “trend followers.” Their “positioning” can have a significant impact on futures market prices. In early October, their net “positioning” was heavily short gold, but that has been reversed (they covered their short positions) as gold prices rallied the past two weeks.
Bonds
Bond prices have been trending lower (yields have been rising) since hitting All-Time Highs in August 2020. At the ATH, the US 10-year T-Note yield was ~0.50%. This week, nominal 10-year rates briefly touched 5.0%, 30-year fixed mortgage rates in the USA reached 8%, and 10-year real rates (~2.5%) are the highest since 2008.
The rate of change since mid-July has been dramatic.
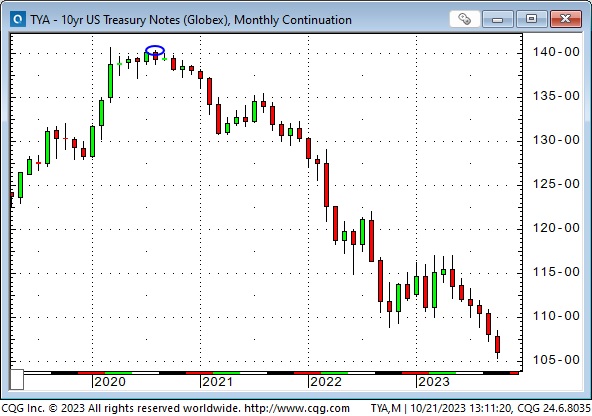
Analysts have offered a variety of “reasons” for the continuing tumble in bond prices, including supply worries as governments continue to run deficits, political instability (especially in DC), the “forever postponed” recession as employment stays strong and as consumers keep spending, price-insensitive buyers (Central Banks especially) halting/reversing their activities, foreign selling, sustained inflation, and the secular shift in Central Bank policies; which means that bonds are having to “adjust” to a new environment after nearly two decades of “un-normal” Central Bank policies that included, in some countries, negative interest rates.
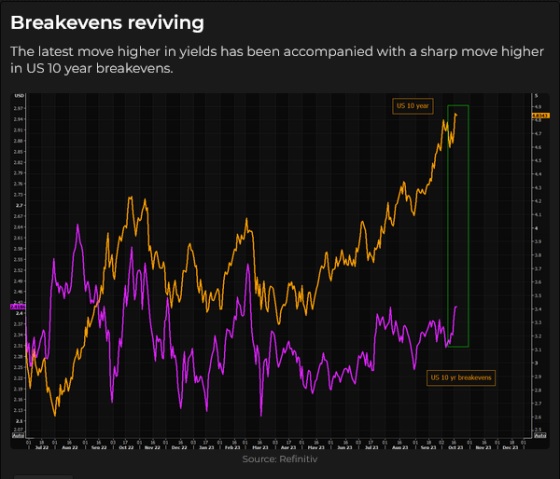
The BIG question is what, if anything, breaks due to soaring bond yields. (One guess is that Canada may be more vulnerable than the US to rising interest rates, given much shorter-term mortgages (that will need to be refinanced at higher rates) and given that “real estate” is a more significant part of the Canadian economy.)
The fact that bond prices fell further this week, despite Mid-East “stress” ( “safe-haven” bids were overwhelmed by sell orders), illustrates the power of the negative trend.
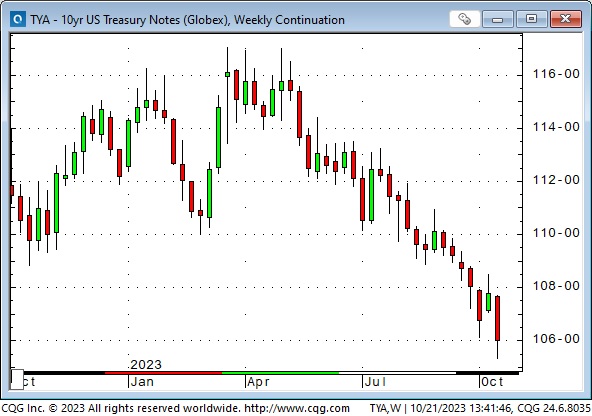
The net effect of Powell’s comments on Thursday drove bond prices to fresh 16-year lows as he stressed that getting inflation down to “target” would likely require sustaining rates at current (or higher) levels for LONGER. (Quoting Jay Powell, “Does it feel like policy is too tight right now? I would have to say no.”)
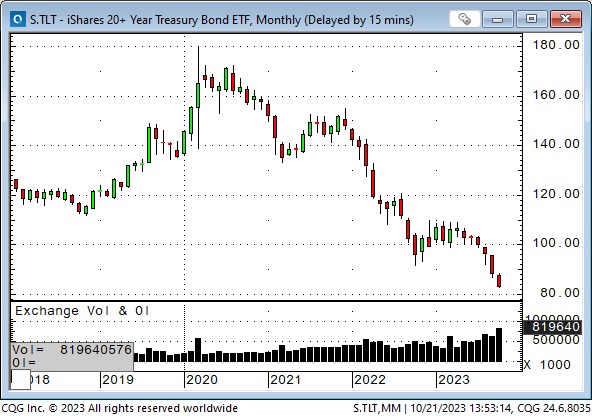
The TLT, the largest bond ETF, has fallen >50% from its 2020 highs but has attracted increasing capital flows as prices have declined (note that recent trade volumes are 3 – 4 times bigger than average 2020 volumes.)
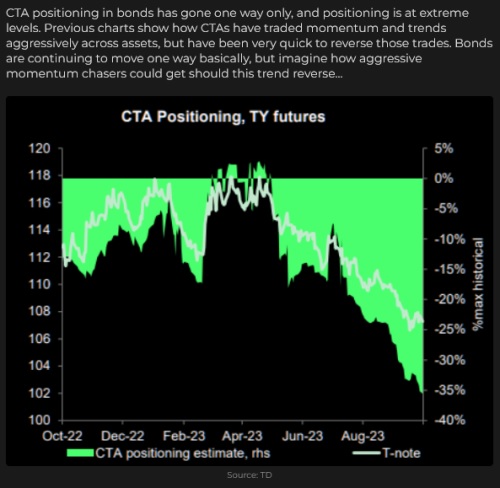
CTAs are heavily net short bond futures. If bonds start to rally, CTAs will have a lot of shorts to cover.
Stocks
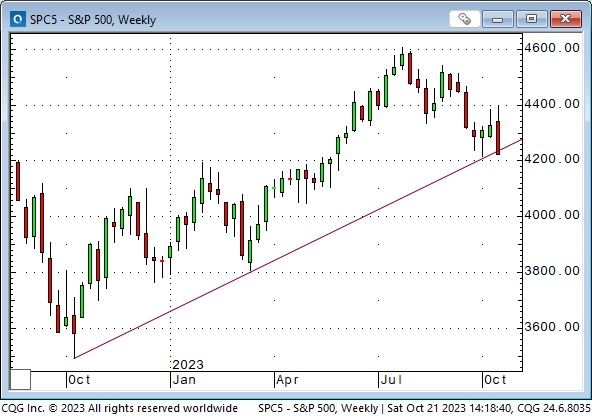
The leading American stock indices made their YTD highs around mid to late July and have trended lower since then – broadly correlated with rising interest rates. The S&P closed this week down ~8% from its July highs and up ~10% YTD. This week’s close was the lowest in nearly five months – on the major trendline from last year’s lows.
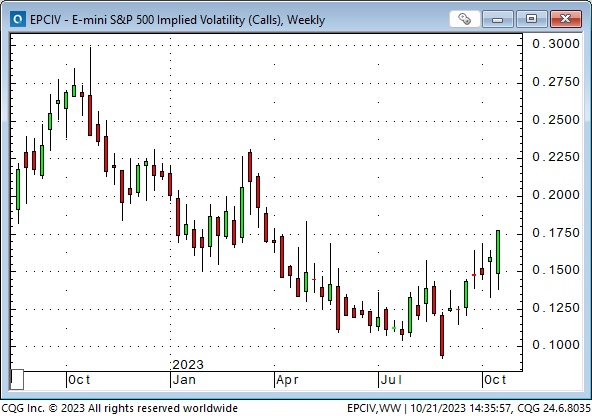
Option volatility on S&P futures closed this week at the highest since March.
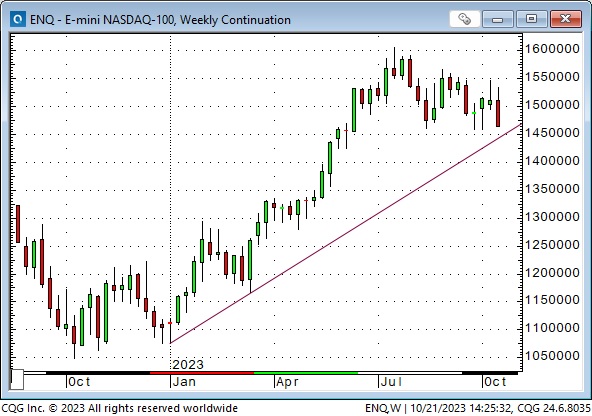
The Nasdaq, with a heavier weighting of Big Cap Tech, made its high in mid-July, up ~45% YTD. It closed this week down ~8% from its mid-July highs; the weekly close was the lowest in nearly five months.
The Russell 2000 also made its YTD high around the end of July but has fallen ~16% since then, down ~5% YTD, with this week’s close the lowest in 12 months.
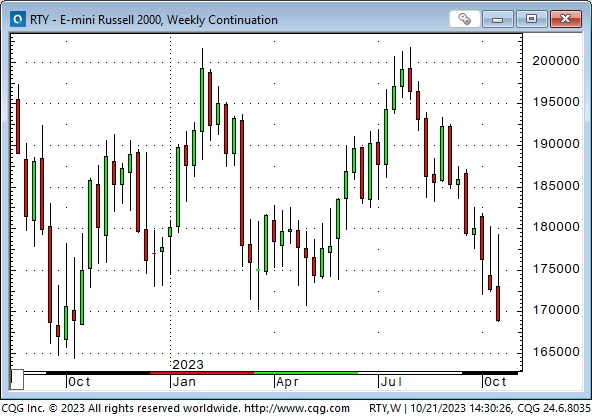
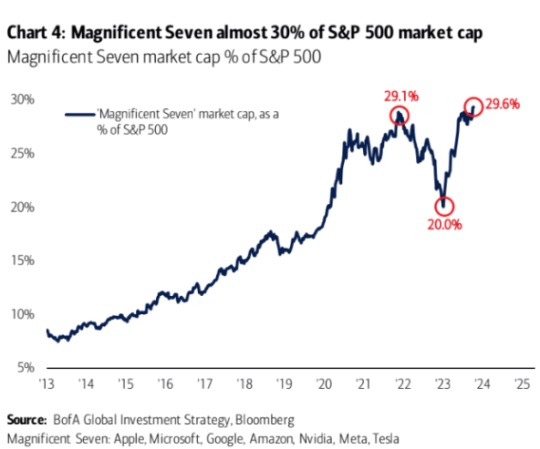
Small caps are under-performing the broad market, which is under-performing the handful of leading Megacap tech stocks.
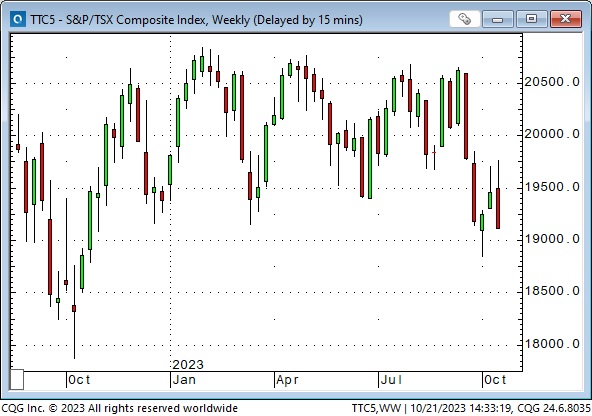
The Toronto Composite Index is down ~1% YTD; this week’s close was the lowest in 12 months.
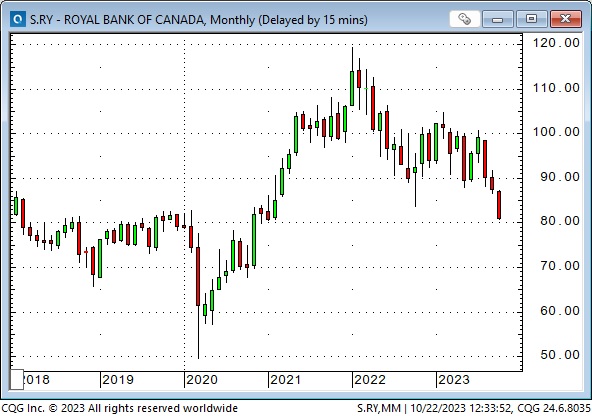
Royal Bank of Canada shares (traded in USD in New York) are at 30-month lows – down nearly 30% from ATH in January 2022.
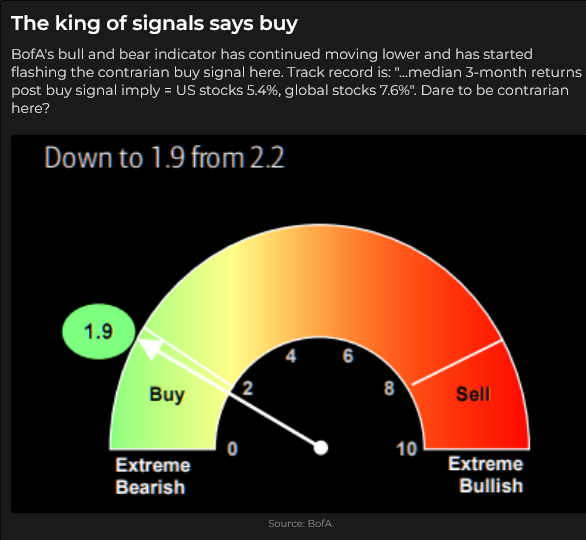
This “contrarian” buy signal is from BoA. It is not a “short-term” signal and just “kicked in” now that the S&P is down ~8% from late July highs. If the S&P falls another 8% and sentiment becomes extraordinarily bearish, this will become a stronger buy signal.
Currencies
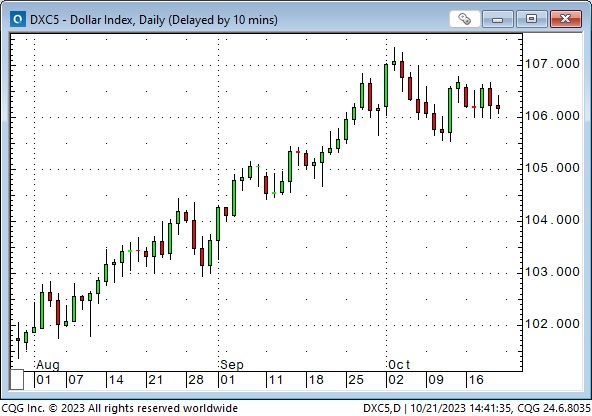
The US Dollar Index closed higher for 12 of the 13 weeks before this week, hitting a 15-month high in early October. The USDX closed slightly lower this week.
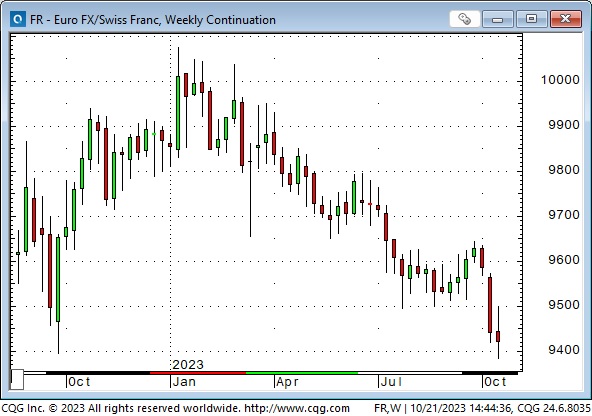
The Euro/Swiss Franc cross had an All-Time Low weekly close last week and traded lower again this week. This is a classic currency market risk barometer.
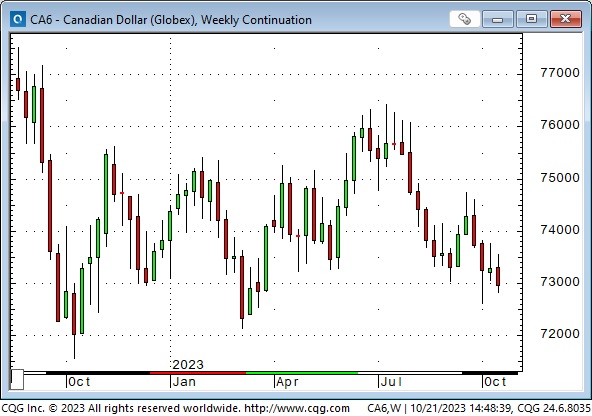
The Canadian Dollar registered its YTD high on the mid-July Key Turn Date and closed this week at its lowest since March.
Energy
WTI crude oil hit a 13-month high of ~$95 in late September, then dropped ~$13 over the next six trading days. It gapped higher on Monday, October 9, following the weekend attacks in Israel, backed off a bit mid-week but closed strong last Friday and continued higher this week.
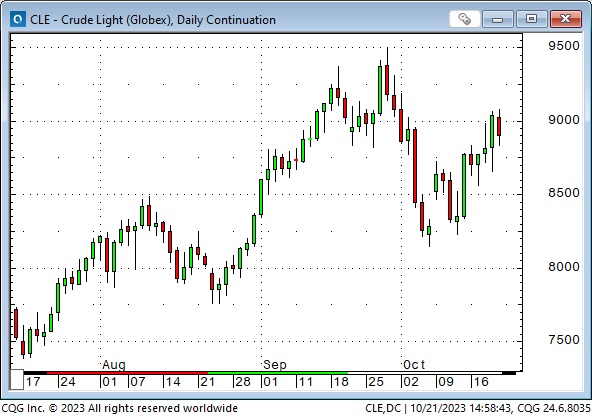
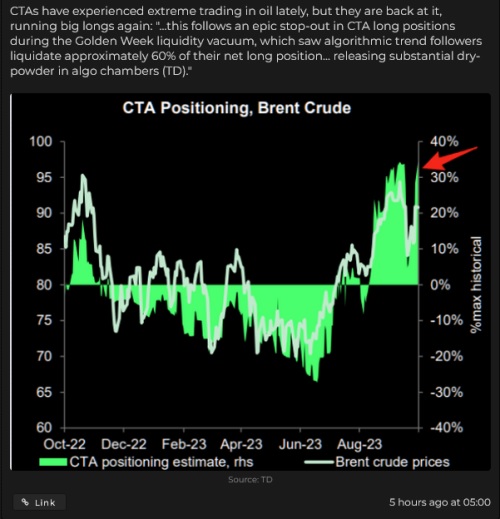
CTAs added to long positions aggressively as WTI rallied to ~$95. They covered aggressively as WTI fell back to $82 and have been buying aggressively on the latest leg higher. Expect price volatility to continue!
Copper
Copper prices made their YTD high in January at ~$4.35 (the ATH was ~$5 in March 2022) and have trended lower since then, with prices this week hitting 12-month lows of ~$3.53.

Soft commodities
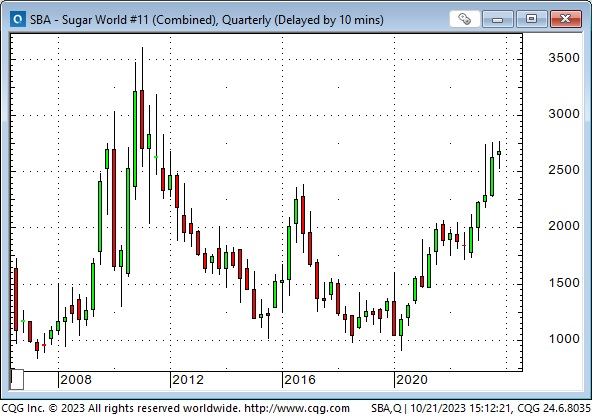
Sugar traded to 12-year highs this week.
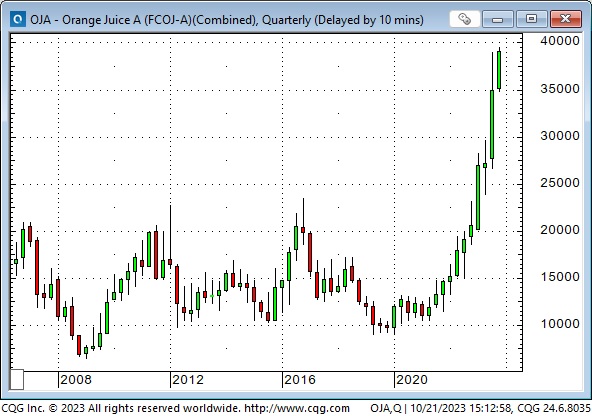
Orange Juice keeps soaring to higher All-Time Highs – up nearly 4X in the last thirty months!
My short-term trading
I bought gold on Friday, October 6, after it reversed from nearly making new YTD lows and rallied above Thursday’s close. I held the position until Wednesday, October 18 (moving my stop higher as gold rose.) I took profits after gold rallied ~$40 from Tuesday’s close but then started to fall back. My net gain on the trade was ~$120.
Taking profits on the trade was a judgment call. I didn’t wait for my stop to be hit. I’ve seen gold spike and quickly fall back on geopolitical stress several times in my career.
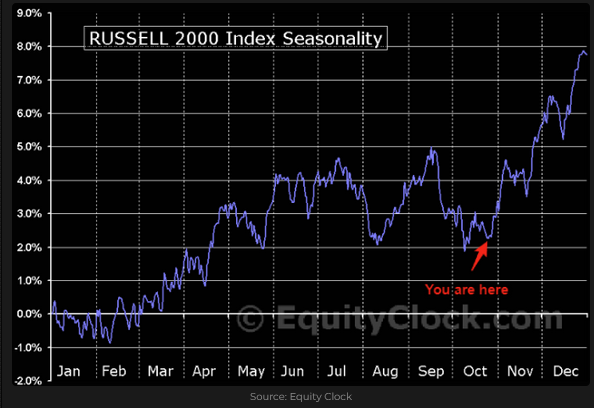
I shorted the S&P on Wednesday and was stopped for a tiny loss on Thursday in the choppy price action that occurred during and following Powell’s speech. I reshorted the S&P later in the day and held the position into the weekend with ~85 points of unrealized gains. I don’t think seasonality is going to play out this year!
On my radar
I’ll be watching how market prices react to the “news.” I think markets have “priced in” a lot of potential “bad news” (conflict widening), so if there is any sign of negotiation or reduced tension, there could be a reversal in risk hedges.
If Mid-East “stress” increases, markets will get wild.
The best thing I did this week was NOT buying bonds, but I’ll buy them when I see a signal that a bottom has been made. My bias is that we will soon start to see signs that the long-delayed recession is “just around the corner.” Corporate borrowing costs have gone up faster than government bond yields.
Google, Amazon, Meta and Microsoft have quarterly reports this coming week.
US Q3 GDP report is due Thursday, October 26 – expectations are >4%. On Friday, personal income, spending and PCE data are expected to show continuing economic strength.
The Bank of Canada meets on Wednesday, October 25; the ECB meets on Thursday, October 26, and the FOMC meets on Tuesday/Wednesday, October 31/November 1.
Thoughts on trading
I often reflect on Peter Brandt’s observation that 100% of his total trading profits over the past 40 years have come from just 15% of his trades. The other 85% of his trades cancelled each other out.
I also reflect on how my trading has changed. Forty years ago, when I was the currency analyst at Conti, my P+L was up 3X for the year, but I often traded so aggressively that my margin requirements were more than my trading capital, and my trading capital was around 50% of my net worth! Yikes!
These days, margin requirements are a fraction of my account capital, and my trading capital is far less than 10% of my net worth.
When I was younger, commodity trading seemed to be about trying to turn $50,000 into $5 million as quickly as possible – or die trying! These days, I’m just trying to earn an excellent return – and not have any sleepless nights!
The Barney report
This is a classic Barney photo. He loves to run off-leash in the forest. My wife took this shot of him this week when they were on trails near the Englishman River. You might notice a bell on Barney’s harness. Salmon are running in the river now, and bears go there to eat salmon to fatten up before they hibernate over the coming winter. We put the bell on Barney so the bears would hear him and (hopefully) stay away from us.

Listen to Victor talk about markets
I talked with Mike Campbell for about 8 minutes this morning on the Moneytalks podcast. We talked about trading rules, time frames and how to manage risk. My segment with Mike starts around the 58-minute mark. You can listen here.

I also had my monthly 30-minute interview with Jim Goddard on the “This Week In Money” podcast this morning. We discussed how Mid-East stress impacts different markets, specifically gold, stocks, bonds, energy and currencies. I also discussed how and why I change my trading when “stress” hits the markets. You can listen here.

The Archive
Readers can access weekly Trading Desk Notes going back six years by clicking the Good Old Stuff-Archive button on the right side of this page.
Headsupguys
There’s a reason I put a link to Headsupguys in my Notes every week. I’ve had friends who took their own lives, and Headsupguys helps men struggling with depression.
If you or someone you know is struggling with depression, talk to them and contact headsupguys. They can help.

Subscribe: You have free access to everything on this site. Subscribers receive an email alert when I post something new – usually 4 to 6 times a month.
Victor Adair retired from the Canadian brokerage business in 2020 after 44 years and is no longer licensed to provide investment advice. Nothing on this website is investment advice for anyone about anything.


