The bond market had a bad Friday
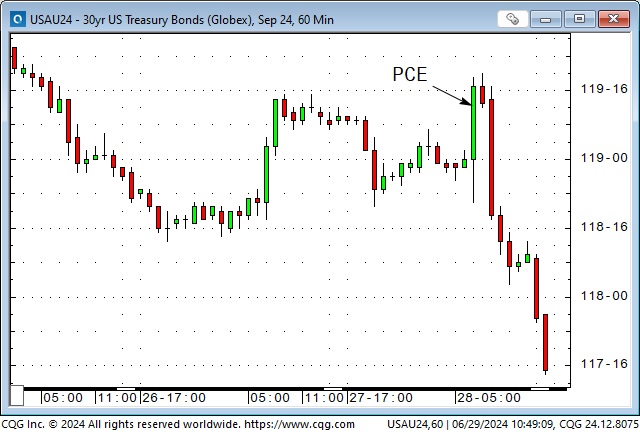
This week, price action across asset classes was “mid-summer quiet” ahead of Thursday’s Presidential debate and Friday morning’s PCE report. There were no dramatic market moves immediately following the debate, and the PCE data early Friday was pretty much as expected, perhaps even a shade “benign” in that it “confirmed” that inflation is settling down, strengthening the case for two Fed rate cuts later this year.
The US Dollar softened on the PCE data, and interest rates across the curve ticked lower. Surprisingly, the S&P rallied a few ticks on the report but fell to overnight lows ahead of the day session opening.
Bond futures traded a few ticks above Thursday’s high once the day session began, but then a relentless decline began, accelerating into the close.
Here’s the daily chart.
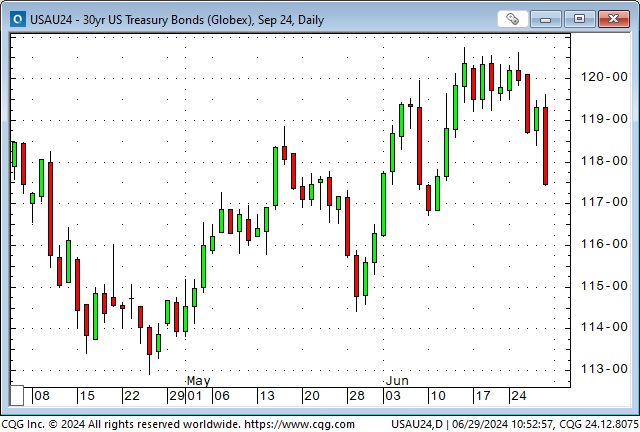
Month-end and quarter-end considerations (re-balancing?) may have contributed to the sharp decline (on heavy volume), but when a market rallies on ostensibly bullish news (the PCE report) and then falls hard right into a Friday close, it sends a very bearish signal.
This week’s bond price action sets up precarious conditions for next week’s employment report, which will be released on Friday, July 5, while many people will be “away” on a four-day weekend.
In last week’s On My Radar section, I wrote: “Given the government funding requirements (and my views of inflation continuing above the Fed’s 2% target), I could see the yield curve inversions going back toward normal.”
This yield curve chart from marketwatch.com shows the 3-month at ~5.37%, the 2-year at ~4.77% and the 10-year at ~4.40% as of Friday’s close.
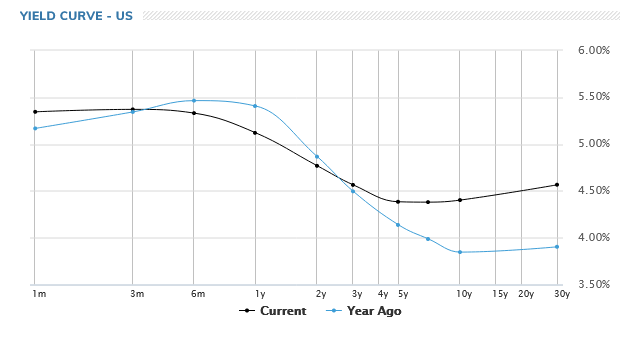
The blue line on the chart represents the curve one year ago and demonstrates that the current inversion is less steep than it used to be. With the Fed “sitting” on the front end, I believe that eventually, longer-term rates will become higher than short rates.
Will a Fed rate cut be a “green-light special” for stocks?
For the past 18 months or so, in my public speaking comments and on this blog, I’ve declared that the stock market would treat a Fed interest rate cut as a “green-light special” and bid prices higher.
I’ve changed my mind. (As Keynes would say, “When the facts change, I change my mind. What do you do, sir?”)
The odds are tilting towards a weaker economy, with consumer spending (especially among lower-income consumers) and employment slowing. A Fed cut will be seen as a defensive move (don’t stay too tight for too long). Stocks might have a knee-jerk rally on a cut (as bonds briefly rallied on Friday’s “benign” PCE data), but that won’t last long.
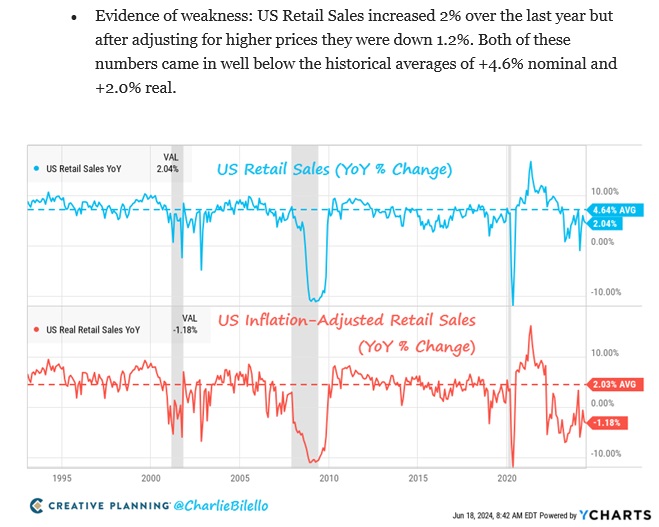
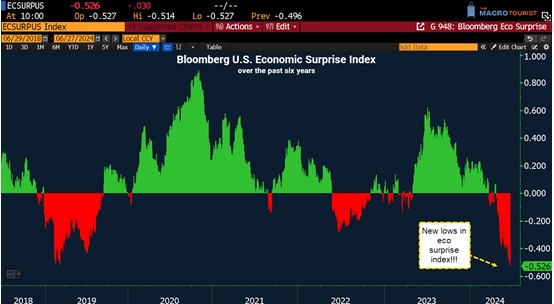
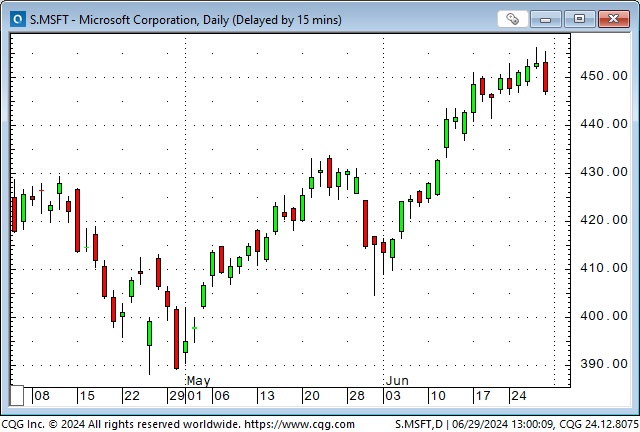
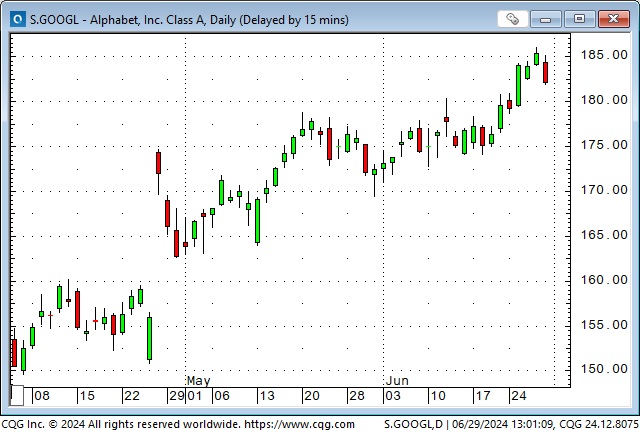
Some new highs in big-cap tech this week, but the indices look toppy
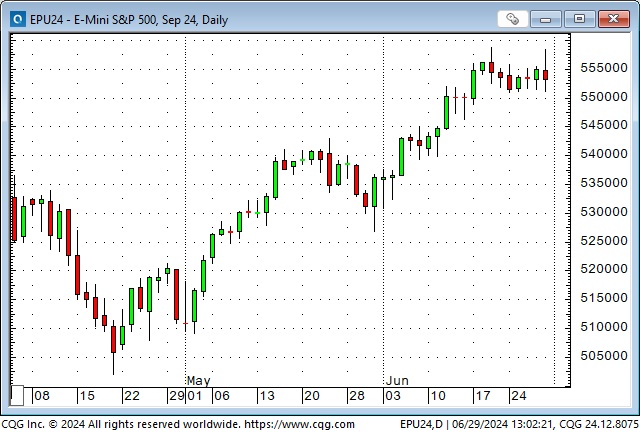
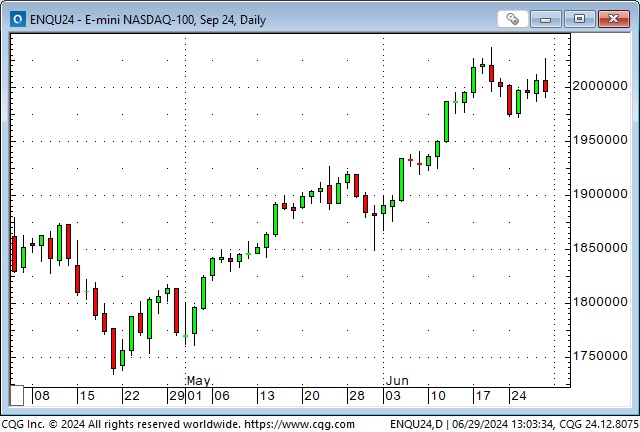
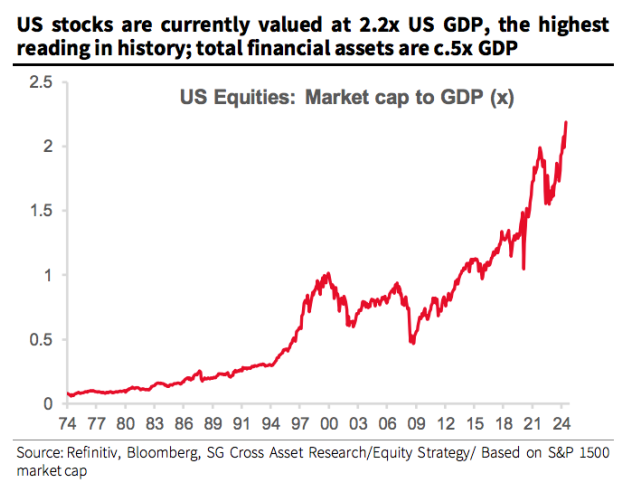
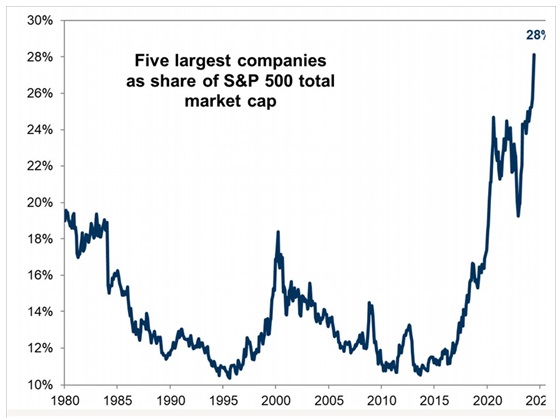
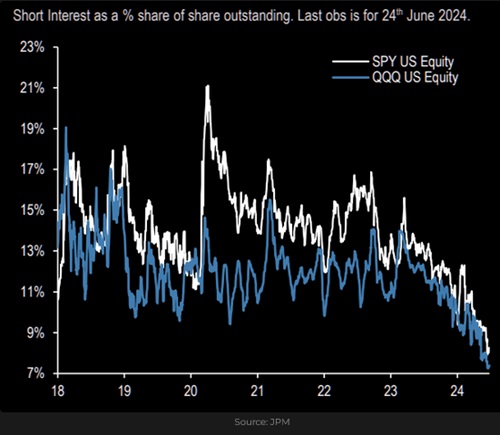
Nobody wants to be short.
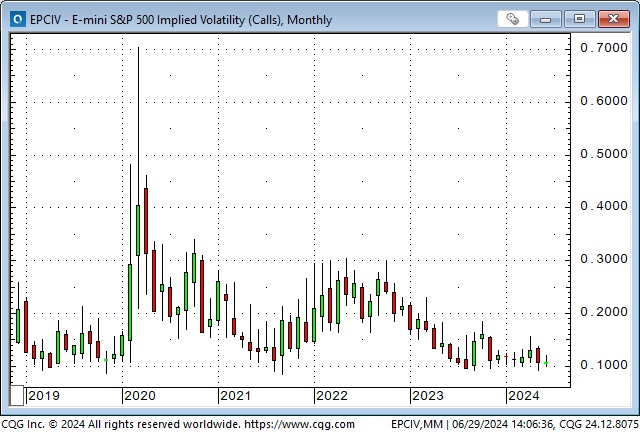
The implied volatility of S&P index futures is currently around the lowest over the past five years. (What? Me worry?)
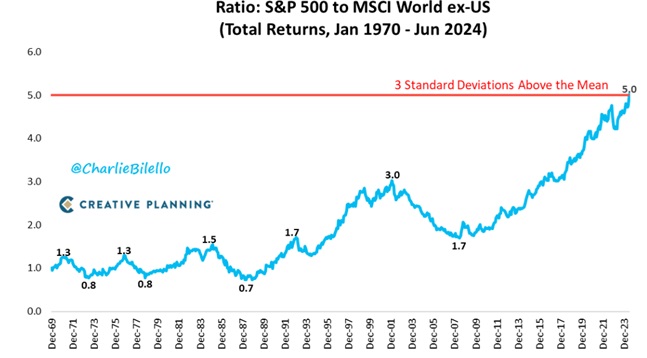
This chart is one of the reasons I keep repeating the phrase, “Capital flows to the USA for safety and opportunity.“
The US Dollar Index rallied to a 2-month high this week
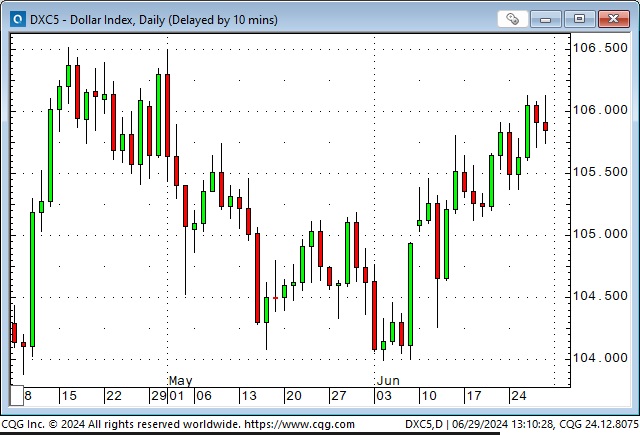
Perennial USD bears might argue that the rally was more about the EUR and the YEN weakening, and that has been a significant factor, but in currency trading, we’re buying one currency and selling another; it’s a “relative strength” game, or as cynics like to describe it, you want to buy the cleanest dirty shirt in the laundry hamper.
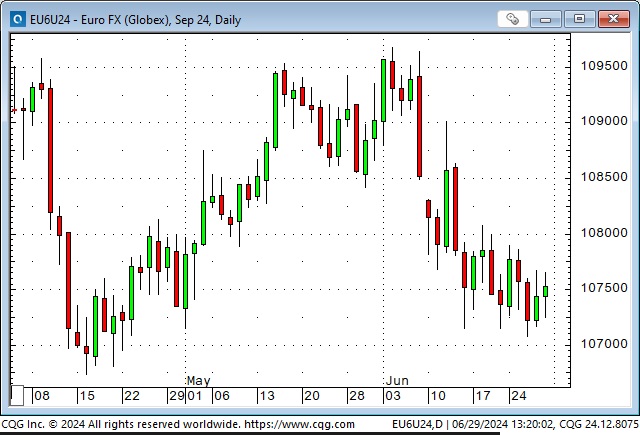
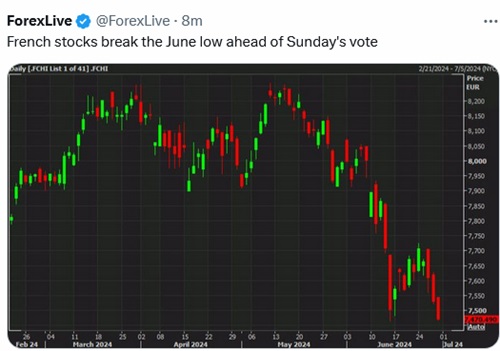
Concerns about France ahead of the national election (1st leg June 30, 2nd leg July 7) have weighed on the Euro, taking it to a 2-month low against the USD.
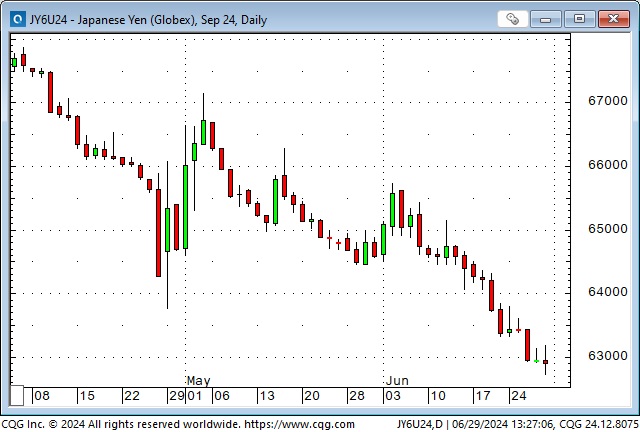
Spot Yen has traded through 160 (Yen/Dollar) this week, so it is weaker now than when the Japanese authorities allegedly spent more than $65 billion in April to “dampen down the volatility” in the FX market. The Yen is at a new 34-year low against the USD, down ~52% from the October 2011 ATH.
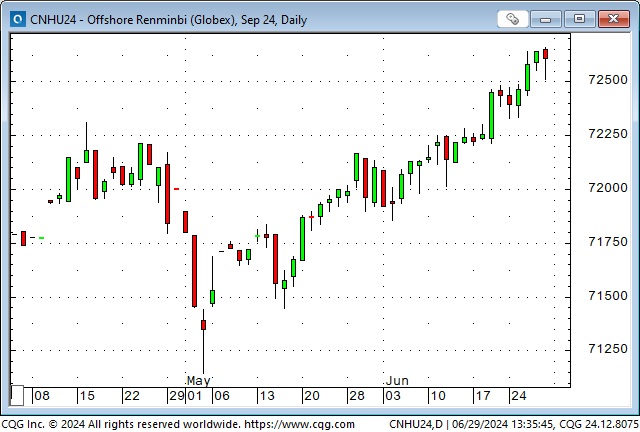
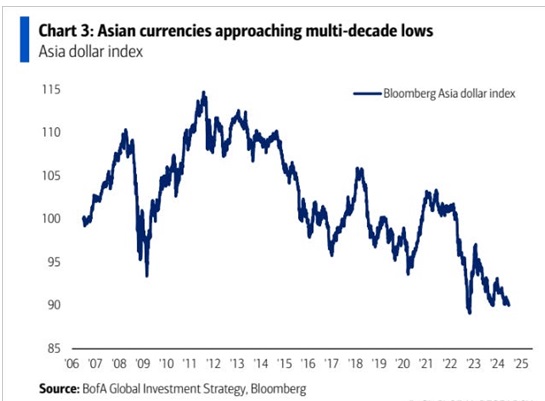
However, the strength of the USD is more than just a reflection of weakness in the Euro and the Yen. Currencies of developing and emerging markets are also weakening (although, to be fair, when the EURUSD is falling, that historically tends to cause most currencies to weaken against the USD.)
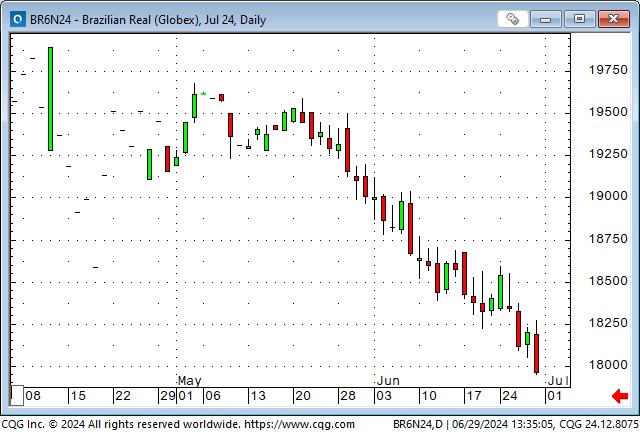
In this chart, rising prices mean it takes more RMB to buy a USD.
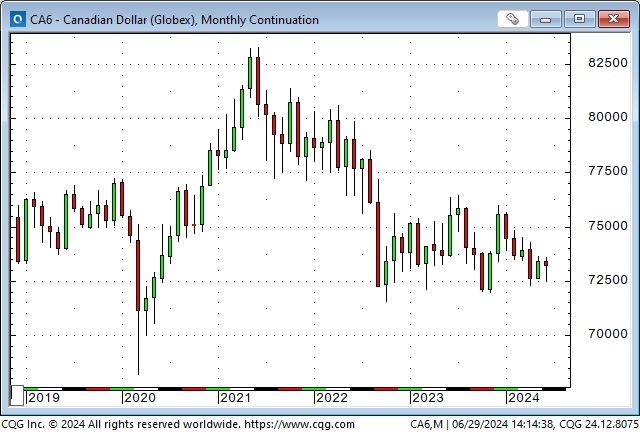
The Canadian Dollar has mainly traded within a 1-cent range since mid-April, but the big story on the CAD has been the buildup of speculative net short positions to all-time highs since March. I wrote about this extensively in last week’s Notes, pointing out the CAD negative interest rate differential to the USD (~75bps on the 2-year) and the looming mortgage refinancing wall for residential properties. I concluded that the CAD could have a big move higher if these shorts are wrong and have to cover or a big move lower if they are right and add to their short positions.
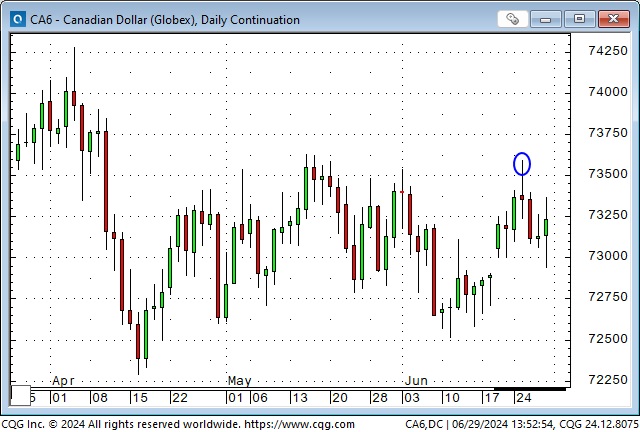
Mid-week, short-term price action favoured the CAD bears when the higher-than-expected Canadian CPI (BoC can’t cut rates) caused the CAD to rally (blue circle on the chart), but it couldn’t hold the gains and fell back. Bears (including me) may have decided that if the hotter CPI kept the BoC from cutting rates, then that’s actually “bad news” for the economy because it likely means higher-than-otherwise mortgage refinancing rates.
The publicly available CFTC COT data gives traders a good idea about how commercial and non-commercial accounts are positioned – but – it does not tell us who they are, why they are positioned the way they are, or how patient they are (what their time frame is.) From a longer-term perspective, if the CAD were to drop below the lows of the past two years (~7150), then a target for the bears below 70 cents would not be unreasonable. On the other hand, a rally above last December’s highs (~7600) might cause the speculators to throw in the towel and buy back their short positions.
I highly recommend Crowded Market Reports to traders who want to learn more about using the COT data. I subscribe to this service because it offers the best user-friendly graphics for looking at COT data over various time frames and because I like Jason Shapiro’s attitudes about trading!
Gold traded in a $50 range this week and closed about dead even with last week’s close
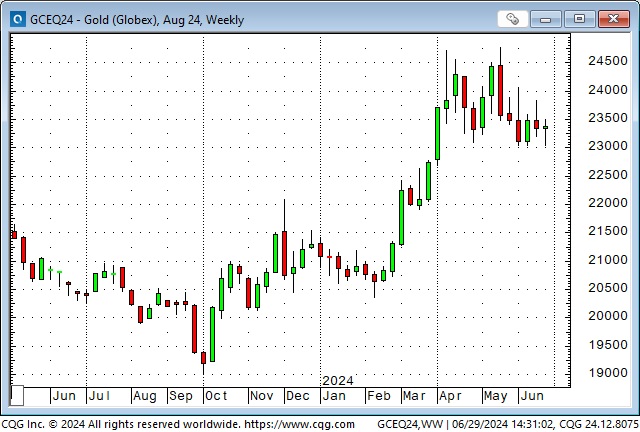
Futures market speculators are now the most net long gold they have been since the invasion of Ukraine in February 2022.
Gold futures rallied from ~$1,900 to an ATH of ~$2,079 in eight trading sessions following the invasion of Ukraine but then fell over $400 to ~$1,650 by September 2022 as the Fed aggressively raised interest rates to “combat” inflation, causing the USDX to rally to 20-year highs.
Speculators are almost always net-long gold and have been net-long for the past 10+ years, save for a couple of months in 2018 when gold fell to ~$1,200.
Gold was trading near last year’s lows of ~$1,800 when Hamas attacked Israel. It rallied to ~$2,450 in May, up ~36% in the eight months since October.
In previous Notes, I’ve written that the ATHs in gold were defined by aggressive buying on the Shanghai futures exchange. Prices are now ~5% lower than those highs, and despite the bullish stories around gold, I suspect the market is vulnerable to more selling from over-leveraged speculators.
Before you dismiss my suspicions, have a look at the copper chart. This market raced higher as speculators bought into the “electrification of everything” story. Has the story changed? No, but the price has.

My short-term trading
I started this week short the S&P. The market barely moved Monday to Thursday, so I covered the position for a tiny loss Thursday ahead of a potentially explosive PCE report on Friday morning. The PCE was a nothing burger, and I reshorted the S&P after it fell back from the initial floor session highs. I stayed short into the weekend.
I shorted the CAD when it failed to sustain its rally on Tuesday’s higher-than-expected CPI report and remained short into the weekend.
On my radar
French elections on June 30 and July 7 could rattle the Euro.
UK elections on July 4 are expected to produce a big win for the Labour party. Anything different than that may move the GBP.
Canadian and American June employment data are scheduled for release early Friday, July 5, when many Americans will be taking a long weekend. With US inflation moderating, any weakening in employment will strengthen the case for Fed cuts.
I can easily imagine the inverted yield curve becoming less inverted and eventually becoming “normal” (where long rates are higher than short rates.) I’m unsure how to manage risk on that idea (it is difficult to manage risk on relative value trades), but I’ll keep looking.
I’ve considered shorting gold but haven’t taken the plunge. Again, it’s the difficulty of managing risk. I could buy puts, but theta is a killer!
The twinning of the Trans Mountain Pipeline is a big plus for Canada in that it boosts export potential by ~500,000 bpd and has narrowed the discount of Western Canada Select vis a vis WTI from ~$20 from July 2023 to March 2024 to ~$13 now. Next year, Canada will start exporting LNG from the West Coast to Asian markets. If the CAD weakens, Canadian energy producers could be generating terrific profits!
The Trump/Biden debate
What can you say? There are 335 million people in the USA, and many of them would rather vote for somebody (anybody) other than Trump or Biden. Trump clearly won the “debate” (The Heisenberg Report said that if it had been a boxing match, the referee would have stopped it), but maybe Team Trump is gloating too early. If Biden decides not to stand for reelection and the Democrats come up with an acceptable “fresh face,” it might be a whole new ball game!
The Barney report
When Barney and I meet people when we’re out for a walk, they invariably say, “He’s such a happy dog.” They’re right. He is a happy boy, and he’s never happier than when he’s running at a full gallop with a stick in his mouth. Here he is, patiently waiting for me to finish writing today’s Notes, chewing on two sticks simultaneously! What a talent!

Listen to Victor talk about markets with Mike Campbell
On this morning’s Moneytalks show, Mike and I discussed the market reaction to the Trump/Biden debate, the massive speculative short position against the Canadian Dollar and whether or not the stock market would rally if the Fed cuts rates. You can listen to the show here. My spot with Mike starts around the 51-minute, 30-second mark.

The Canadian Association For Technical Analysts
On Thursday evening, Blair Carruthers from CATA interviewed me. We discussed some techniques I use to select trades and manage risk, as well as what I call “The Trading Life.”
CATA is a premium educational resource catering to non-professional Technical Analysts. They offer valuable learning opportunities through frequent meetings with prominent presenters. Members also network with each other to further their trading and investing skills. Click here to learn more.
This week in money
I provided a 10-minute weekly market summary this morning to open the This Week In Money show. You can listen to the show here.

Heads up Guys
Regular readers know I keep posting links to Headsupguys because I’ve had too many friends who took their own lives. So many times when that happens, people say, “I would have done something if I’d known he was struggling.”
If you, or someone you know, is down or depressed, reach out to these guys. They can help.

The Archive
Readers can access weekly Trading Desk Notes from the past seven years by clicking the Good Old Stuff-Archive button on the right side of this page.
Subscribe: You have free access to everything on this site. Subscribers receive an email alert when I post something new, usually four to six times a month.
Victor Adair retired from the Canadian brokerage business in 2020 after 44 years and is no longer licensed to provide investment advice. Nothing on this website is investment advice for anyone about anything.

