Interest rates rose again this week; stocks, bonds and gold fell while the US Dollar rallied
I began last week’s Notes by pointing out that markets had been “fighting the Fed” for the past couple of months by expecting the Fed to “pivot” – to start cutting interest rates – by mid-2023 despite repeated warnings from Chairman Powell that the Fed WOULD NOT cut rates in 2023. Powell’s rationale was that cutting rates too early might re-ignite inflation expectations, and that was not a risk he was willing to take.
I went on to note that markets had begun to “back away” from fighting the Fed on February 2, a date I called a “Key Turn Date” because several markets reversed course that day and the “common cause” for correlation across those markets was a sensitivity to the Fed holding rates higher for longer than previously thought.
Key Turn Dates “alert” traders that “something important” must have happened if several different markets all reversed course on/around the same date. However, a KTD cannot be confirmed until after the fact, and the validity of the KTD may need to be “tested.” I suggested last week that the “test” of my KTD idea would be the market’s reaction to Tuesday’s CPI report.
The market’s reaction to the February 14 CPI report confirmed the expectation that the Fed will take interest rates higher, and keep them higher for longer than previously thought
The June SOFR (Secured Overnight Financing Rate) futures contract has dropped ~42bps since February 2. It is now implying ~5.3% s/t interest rate in June, a new high.
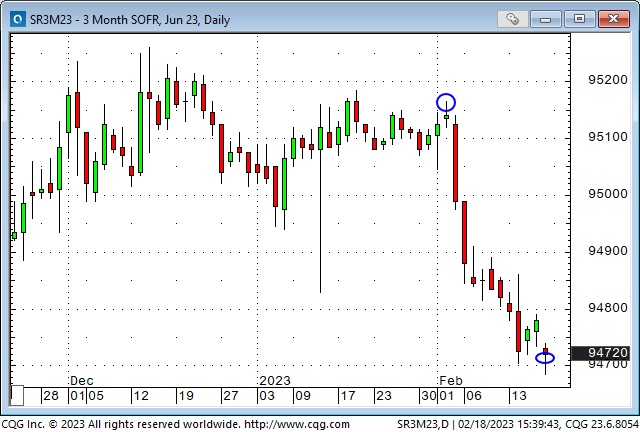
The market still expects the Fed to cut rates in H2 – the December SOFR is implying a ~5% rate, ~80bps higher than where it was on February 2.
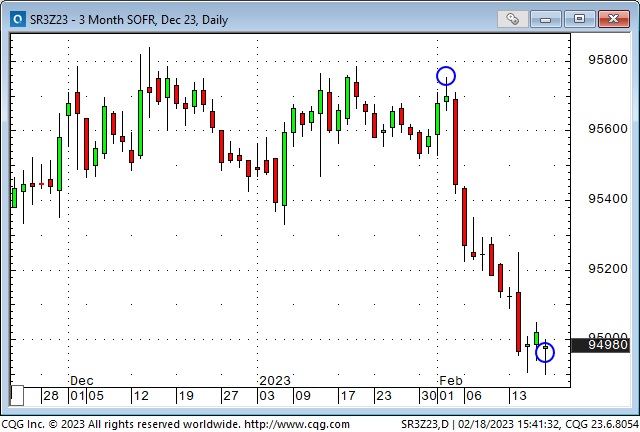
The 1-year US Treasury bill yield traded to a 16-year high of ~5.8% this week.
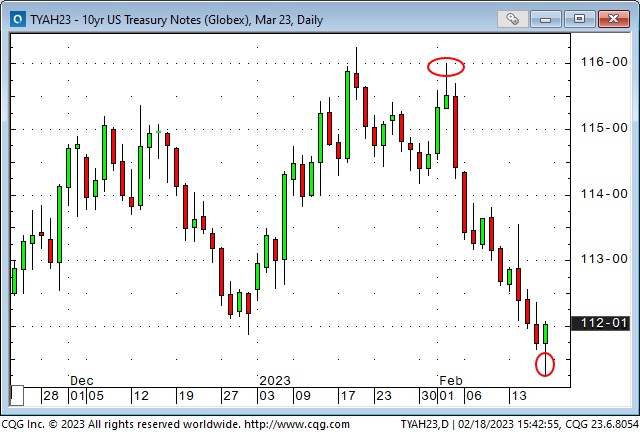
The 10-year US Treasury Note yield traded to a high of ~3.9% this week, ~45 bps higher than where it was on February 2. It was ~4.25% in October, a 14-year high. This is a chart of the 10-year T-Note future. Lower prices imply higher yields.
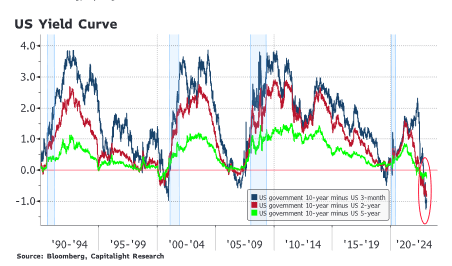
Various US yield curves have become more deeply inverted (short rates are rising faster that longer rates.)
Markets are also pricing the ECB and the BoC to push s/t rates higher with the ECB expected to be at ~3.55% in June and the BoC at ~5%, which is ~50bps above current levels – even though the BoC announced a “pause” at their last meeting.
Interest rates are rising because 1) inflation is sticky, 2) some economic data (employment, retail sales) is robust, 3) a recession looks less likely, 4) some Fed speakers have indicated a possible 50 bps rise at the next FOMC meeting.
Correlations
For most of my trading career I’ve looked at correlations between markets for clues to what may be happening – or about to happen. I remember interviewing Jim Rogers more than twenty years ago and he asked me, “How can you trade wheat in Chicago if you don’t know what is happening to iron ore in China?”
I also remember more than forty years ago Martin Armstrong pointed out that the DJIA was hitting new highs in USD terms, but not in Swiss Franc terms. That insight gave me a new “macro correlation” way of looking at markets!
Jimmy’s example and Martin’s example are both “relative value” correlations. Another example would be the correlation between AUDJPY and copper. (Australia exports copper, Japan imports copper. If copper prices are soaring that helps Australia, hurts Japan, which might mean that AUDJPY would rise.)
Relative value correlations can be “all over the map” in terms of price swings and are hard to trade or hedge. They may be more useful as “thought provoking” spreads rather than trading opportunities.
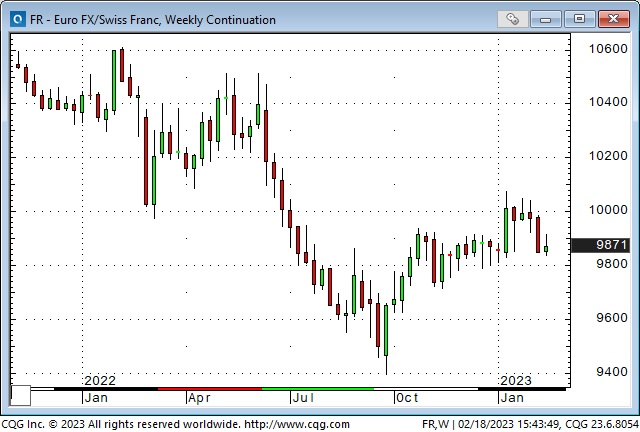
One of my favorite currency spreads is EURCHF. If it is falling, I see that as a sign that Eurozone capital is “worried” and is seeking safety in the Swiss Franc. In this Euro/Swiss chart the Euro fell against the Swiss for most of 2022 until late September, when the Euro began to rally against both the Swiss Franc and the USD. The September low on this chart was a record low, coming at the same time the Euro traded at a 20-year low Vs. the USD.
At public speaking events over the years I’ve often illustrated the importance of inter-market correlations by describing a trader in the Chicago soybean pit anxiously looking over his shoulder to see what is happening in the bond market or the stock market – because that might have an impact on soybean prices!
All markets are interconnected to some degree, and as I watch the correlations between markets change my favorite question is, “Why is that happening?”
Market changes since the February 2 Key Turn Date
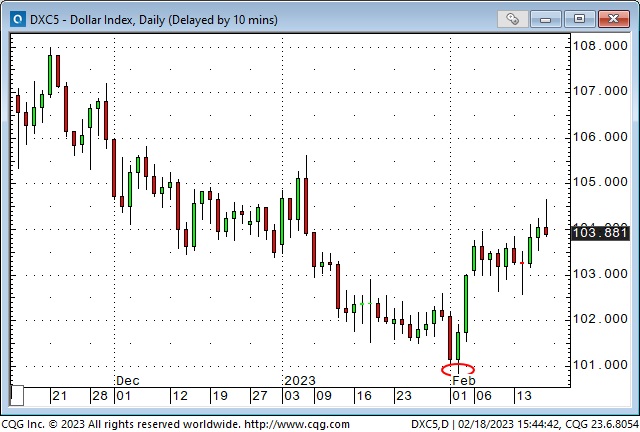
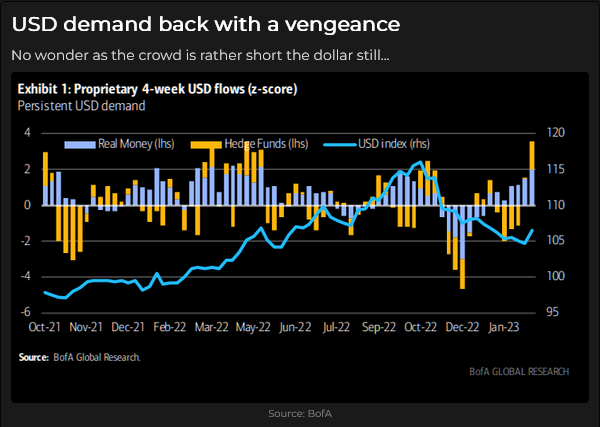
The US Dollar Index hit a 10-month low on February 2 and rallied ~3.75% to Friday’s high.
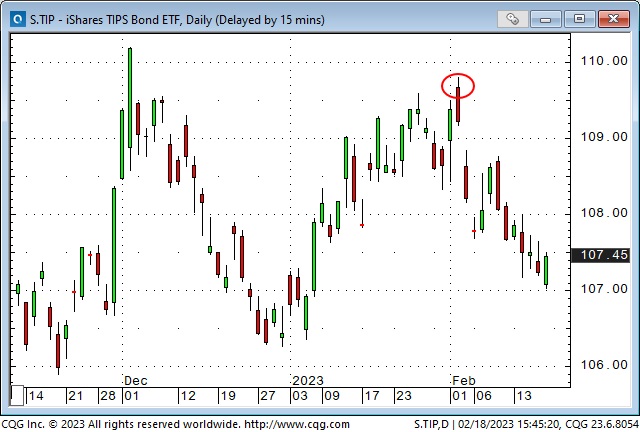
Real and nominal yields reversed higher on February 2.
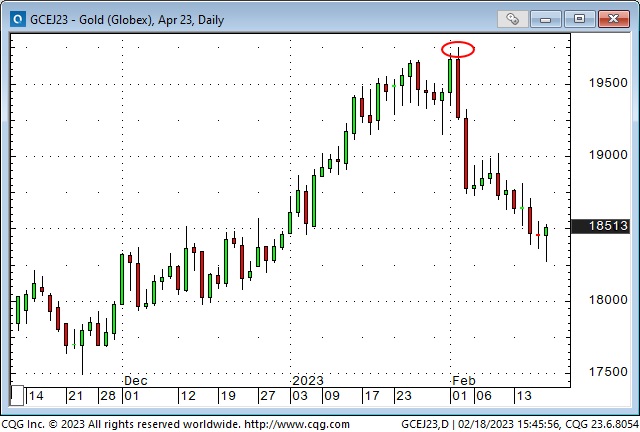
Gold hit a 10-month high on February 2 (after rallying ~$340 from November) but fell ~$140 to Friday’s lows as both the USD and real interest rates rose. (YTD negative correlations between USD and gold and between 10-year real interest rates and gold are ~90%.)
The S+P and the Nasdaq both hit ~5-month highs on February 2, and turned lower after rallying ~20% from 2-year lows made last October.
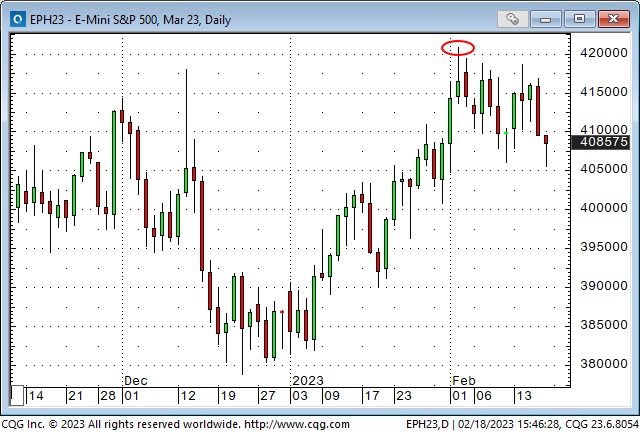
There is an interesting anomaly in the stock indices. Despite a rather dramatic repricing of anticipated Central Bank policies in the credit and currency markets, North American stock indices are down from February 2 levels, but not by much. Why is that?
The TSE Index is down only ~1% from February 2 close.
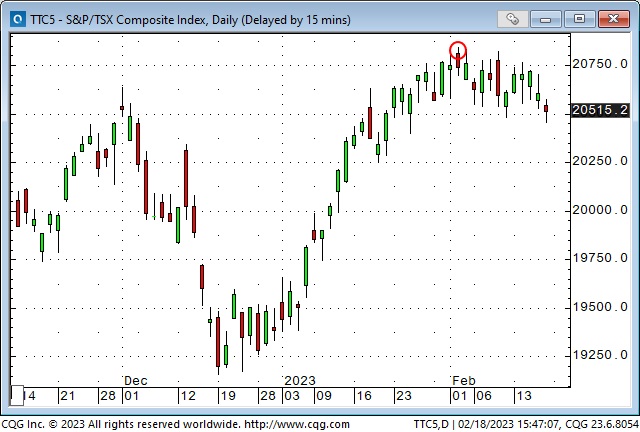
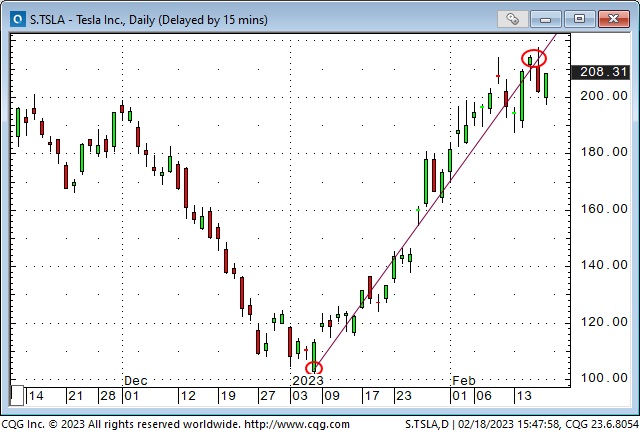
One thought is that the stock indices, and particularly FOMO speculative issues, have had a strong rally YTD and that “momentum” is self-sustaining. (Note that TSLA is up >100% YTD!) Perhaps equity buyers see this latest round of anticipated Fed rate increases as the “last one” which signals a “green light” buying opportunity.
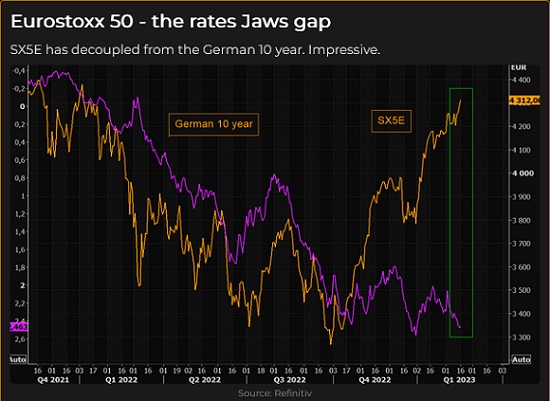
The Eurostoxx 50 has rallied ~34% from last October lows, handily outperforming the North American indices. It is trading above its February 2 highs, is not far from November 2021 All-Time Highs, and has been a big part of the “Buy Europe” play that has taken the Euro up from September’s 20-year low. It has surged higher even as Eurozone interest rates have risen (purple line inverted in this chart.) It could be especially vulnerable to bad news from Ukraine.
Alternatively, perhaps equities are in a “world of their own” and haven’t recognized the seriousness of the signals coming from the credit markets.
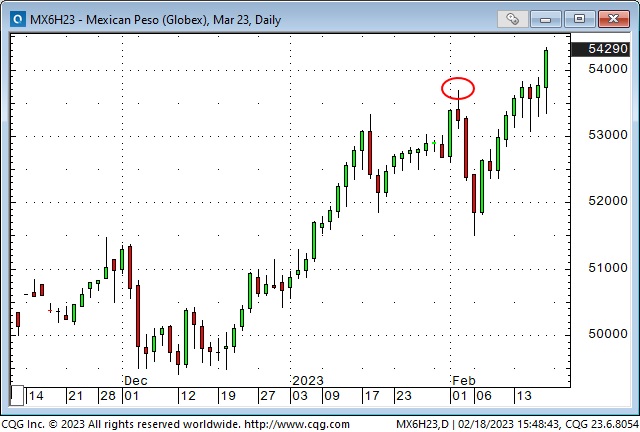
The Mexican Peso is the world’s strongest currency
The Mexican Peso hit a 2-year high against the USD on February 2, then dropped like nearly all other currencies – but – it has since rebounded to a 5-year high against the USD. The Mexican Central Bank raised s/t rates 50bps to a record high of 11% at their February 9 meeting, their 14th consecutive increase, as they try to bring down inflation.
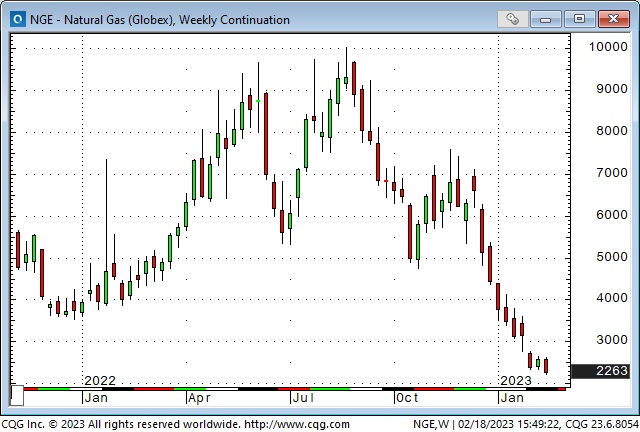
Natural gas prices keep falling
Natgas prices on the Nymex fell to more than a 2-year low this week, down ~80% from last summer’s 14-year highs. European Natgas prices, which spiked to astonishing levels last year have also fallen dramatically.
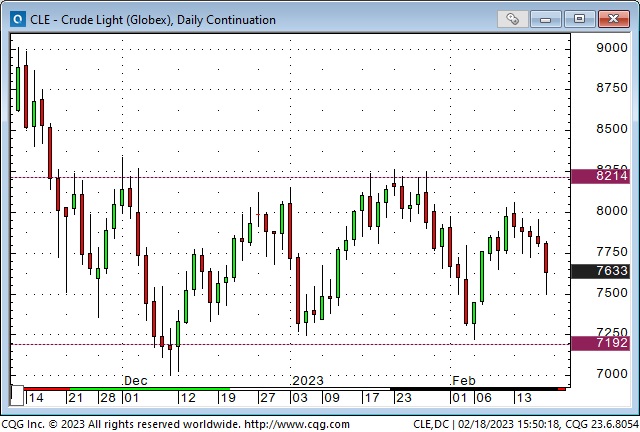
Nymex traded WTI crude oil has traded in a relatively narrow range between ~$72 and ~$82 for the last three months.
My short term trading
I started this week flat and waited until after the CPI report Tuesday morning before taking a position. Over the past several months the CPI report has generated wild price swings that make it difficult to manage short term trading risks.
The price swings following Tuesday’s report were relatively modest compared to recent months. I shorted the CAD and bought Euro puts (50 day, 30 delta) keeping with my plan to be bullish the USD.
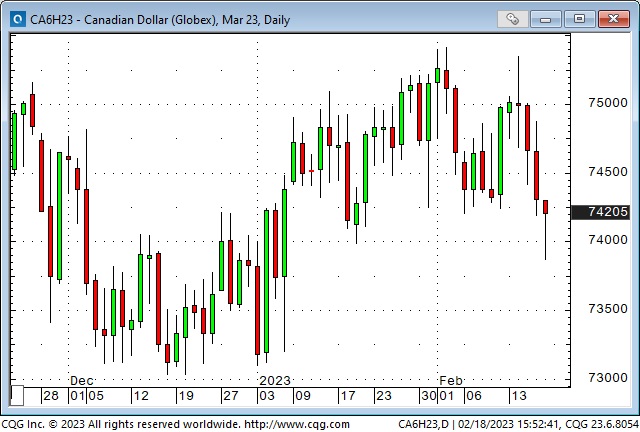
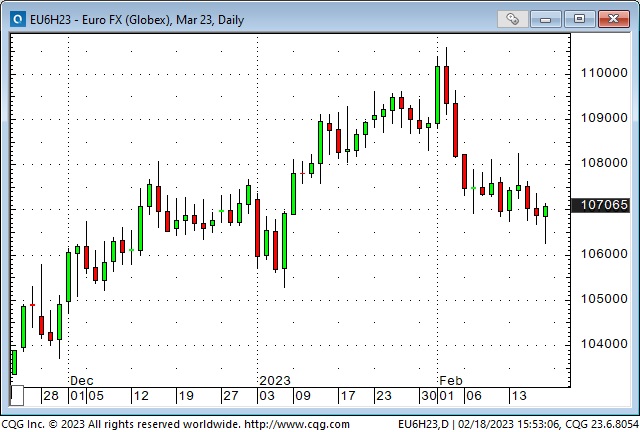
I covered both positions Friday morning when the CAD and Euro fell to 6-week lows but began to rally back as the US bond market went bid. I made ~75 points in the CAD but only 15 points in the Euro puts. I’m flat going into the weekend.
Coming into this week I had planned to look for opportunities (post the CPI report) to short stock indices. I didn’t do that because the stock indices seemed to be “holding up” better than I thought they would given the “pressure” from higher interest rates. (This is similar to the trading axiom that you should buy a market that doesn’t fall on “bad” news.)
On my radar
I bought Euro puts this week because I wanted a limited risk open-ended bearish exposure to the Euro. I watched the Euro rally `15% from 20-year lows last September and thought it was overbought, especially considering the risks of an unexpected geopolitical shock from Ukraine. I have a hard time justifying taking small profits on the position on Friday, other than a trader’s intuition the market was going to bounce. I’ll be looking to re-establish the trade.
I wrote last week that Natgas might be a buy – I liked the convexity of being long “cheap” energy given my view that markets are under pricing global geopolitical risk. I didn’t pull the trigger, but I’ll keep watching that market.
As noted above, the stock indices haven’t taken much of a hit considering the sharp rise in interest rates. If they go bid, I might be a buyer even though I’ve had a bearish bias. If they start to sell off, I will try to get short because parts of the market have been aggressively bid lately.
The Barney report
My wife and I went to Victoria on Monday to wave goodbye to my stepson as he sailed away on his navy ship for his first major deployment. We left Barney in the care of a lovely young lady who runs a house/dog sitting business. She loved Barney and re-named him Barney the Bear! I’ve no doubt that Barney was spoiled rotten while we were away, and I’ve no doubt that we will call on this young lady the next time we plan to go away!
Here’s Barney guarding the stairway to the Trading Desk.

Listen to Victor talk about markets
I’ve had a regular weekly spot on Mike Campbell’s extremely popular Moneytalks show for >22 years. You can listen to us talk about markets on February 18 on the Moneytalks podcast.
I recorded a 30-minute interview with Jim Goddard on February 10 for This Week in Money. You can listen to it here.
Headsupguys
At the World Outlook Financial Conference, I had the opportunity to briefly tell the audience about Headsupguys and why I support the work they do.
I support this project because I’ve had friends who took their own lives. Headsupguys helps men deal with depression. Headsupguys has had over five million hits on their website, and over a half million men have taken the self-check. Most men who click on the website do so after midnight their local time. Headsupguys saves lives.
The Archive
Readers can access weekly Trading Desk Notes going back five years by clicking the Good Old Stuff-Archive button on the right side of this page.
Subscribe: You have free access to everything on this site. Subscribers receive an email alert when I post something new – usually 4 to 6 times a month.

