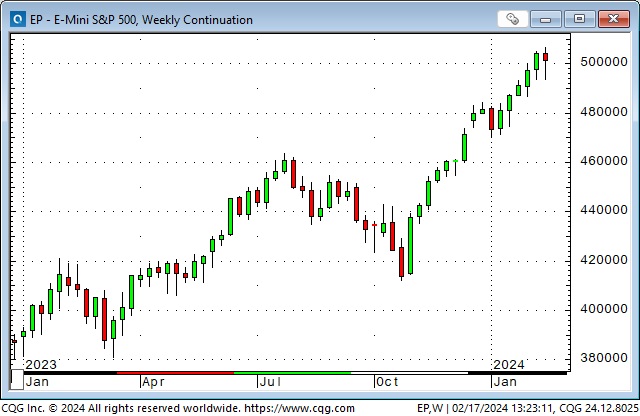
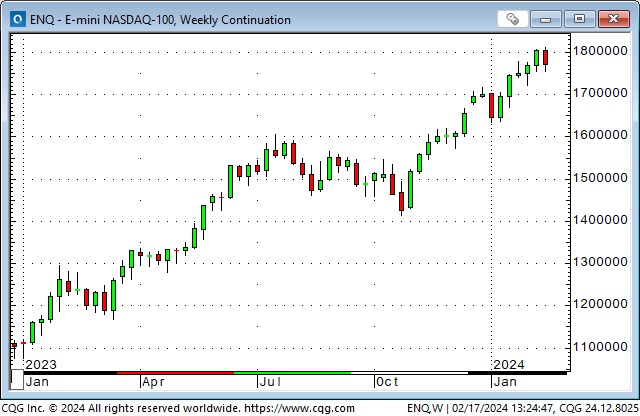
Leading US stock indices lose upside momentum
The DJIA, S&P and the NAZ made new All-Time Highs this week but closed lower on the weekly charts.


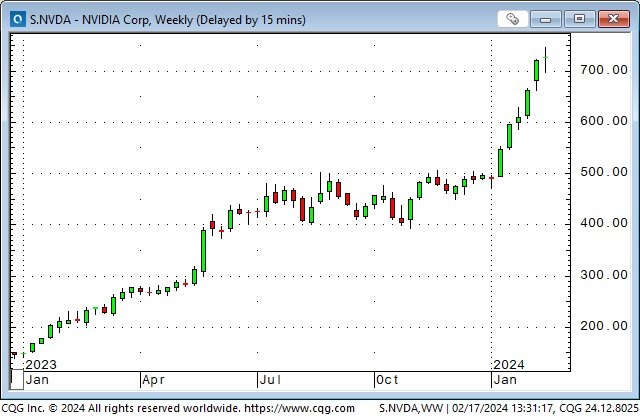
NDVA continued to rally this week, up 53% YTD, up 224% in the last 12 months, and now has the 3rd largest market cap (after MSFT and AAPL) of all US stocks at $1.83 trillion.

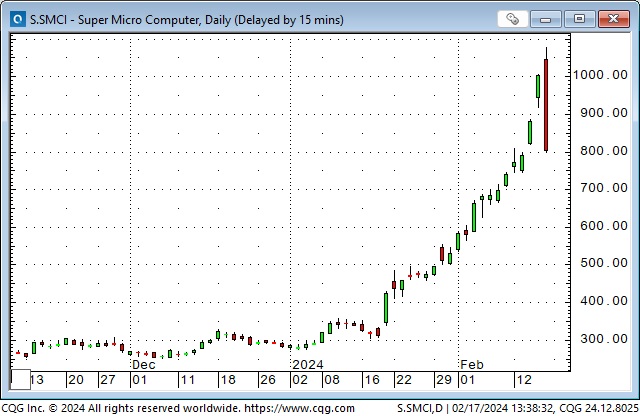
Super Micro Computer is the New Kid on the block, soaring >3X in twenty days to reach a market cap of ~$60 billion at Friday’s high. (By the close, the market cap had dipped to ~$45 billion.)
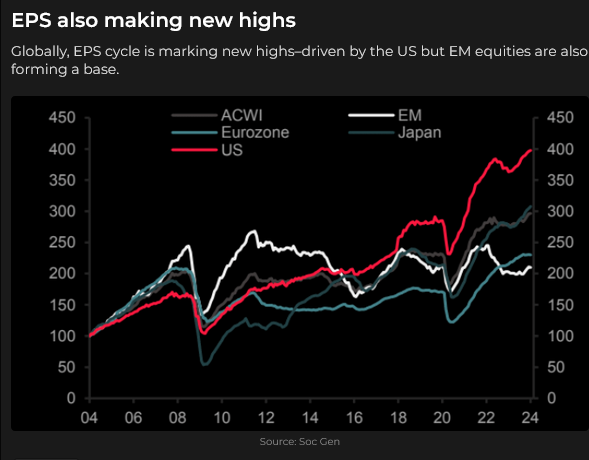
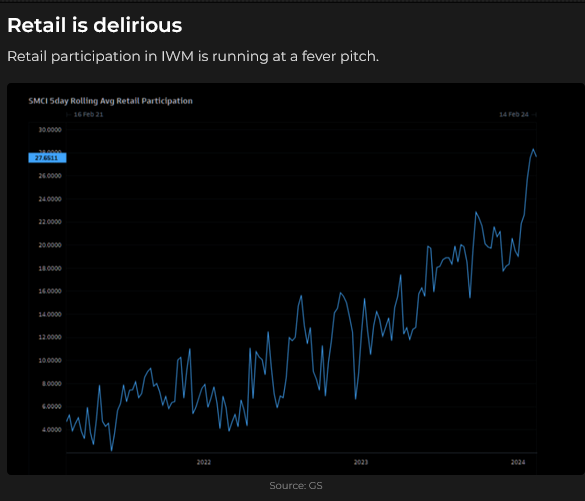
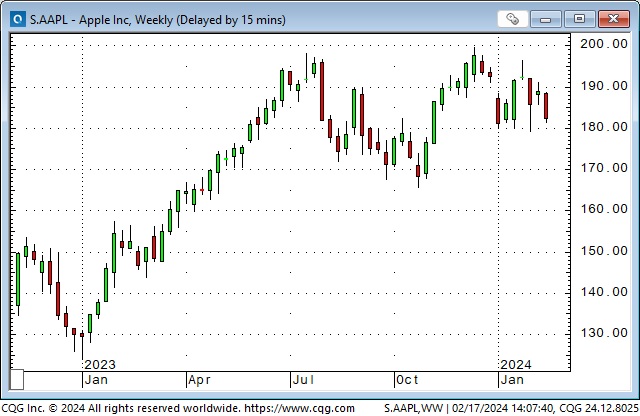
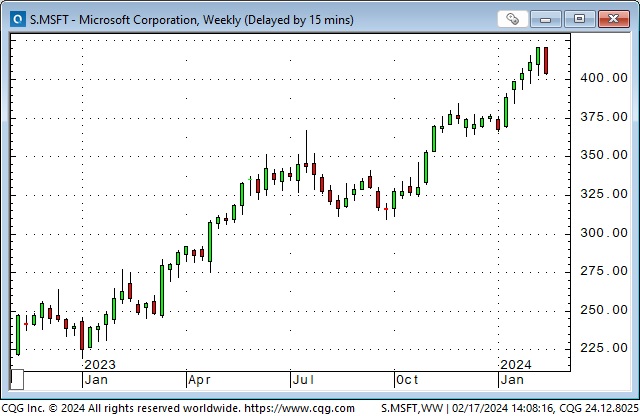
AAPL made All-Time Highs in December but has slipped ~9% since then, giving up the leadership crown to MSFT. (~20% of AAPL sales are in China, and sales there are down.) Both companies have ominous-looking charts this week.
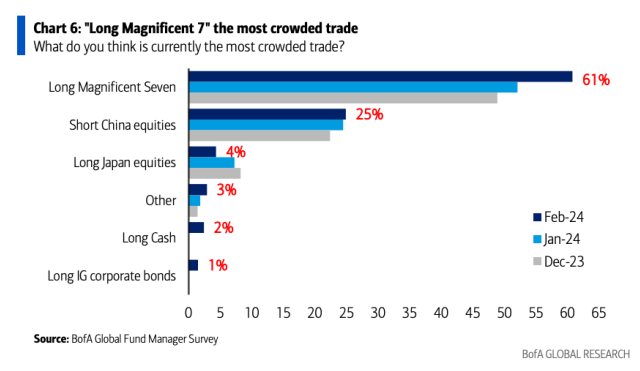
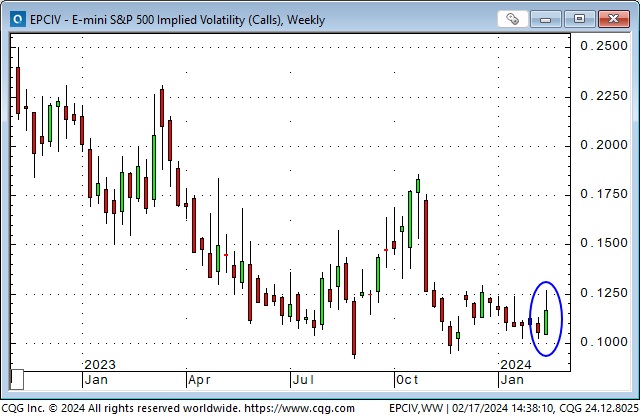
Equity market volatility shrunk dramatically as the leading indices rallied from the October lows, and it has stayed within a narrow range near multi-year lows YTD – but spiked to 2-month highs this week.

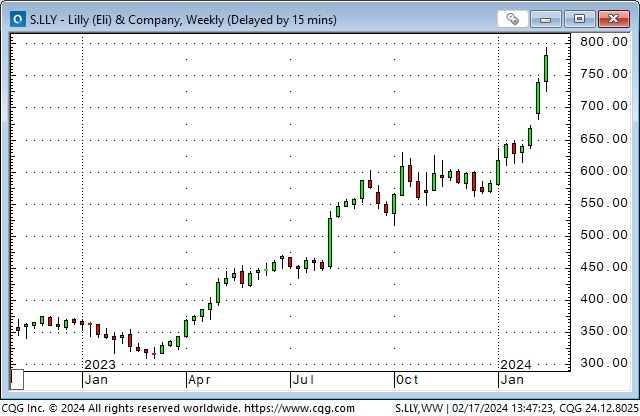
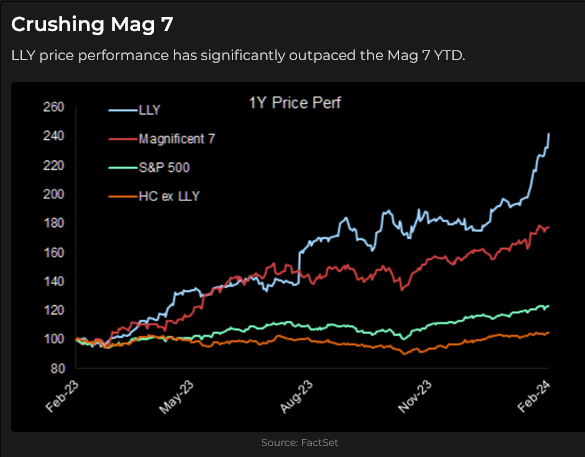
Big-cap tech stocks have led the rally off the October lows but are not alone in posting robust gains. Eli Lilly is up ~36% YTD, with the market cap increasing by ~$200 billion to ~$780 billion.
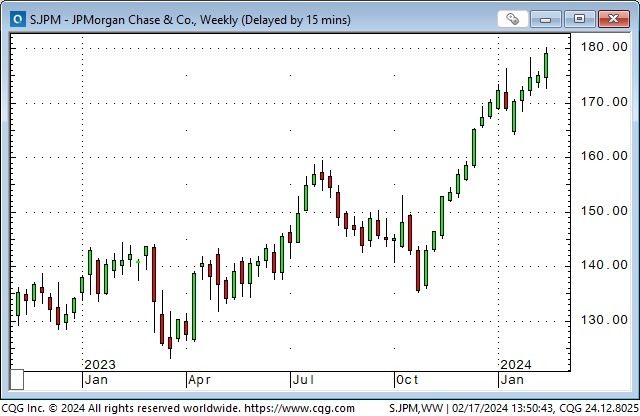
JPM has led the banking sector, up ~32% from the October lows to All-Time Highs with a market cap of ~$520 billion.
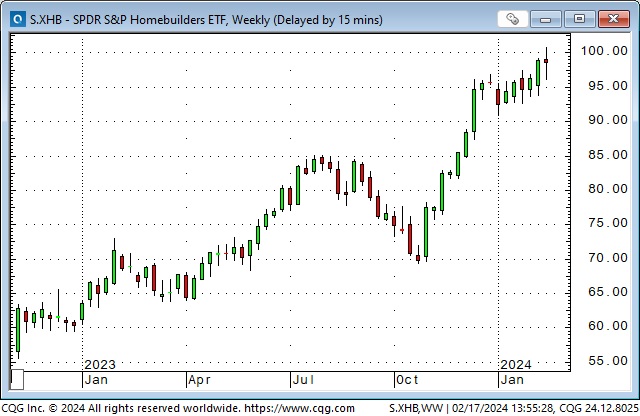
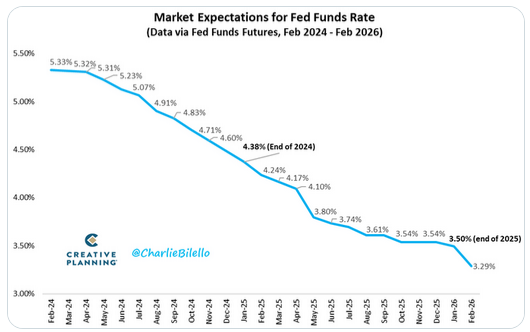
The home building sector is up ~43% from the October lows, as markets expect interest rate cuts from the Fed to fuel demand for new homes.
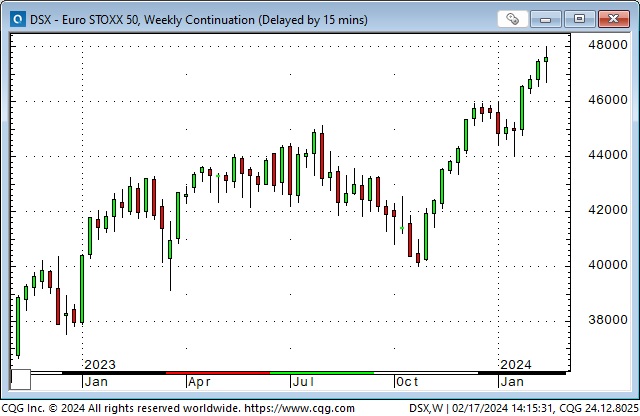
International equity markets have also had a great run off the October lows. The Euro Stoxx 50 (a European version of the DJIA) has rallied ~20% to 23-year highs.
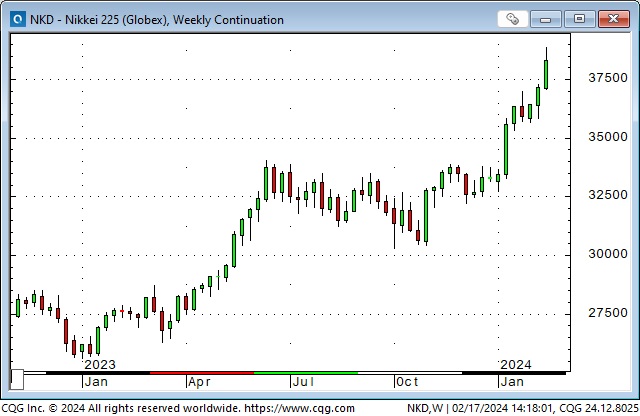
The Japanese Nikkei is up ~27%, just a few points away from touching the All-Time Highs made in 1989.
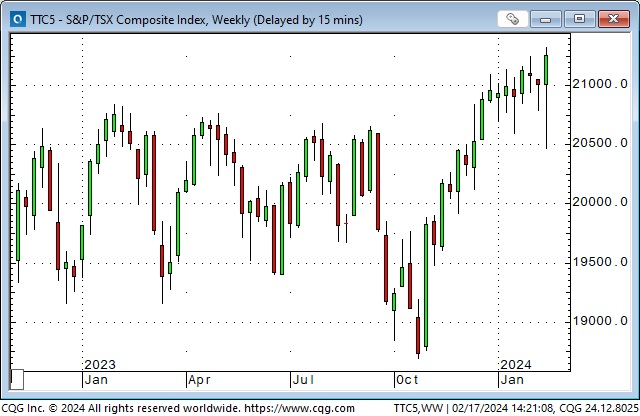
The Toronto Composite Index closed this week at a 22-month high, up ~17% from the October lows.
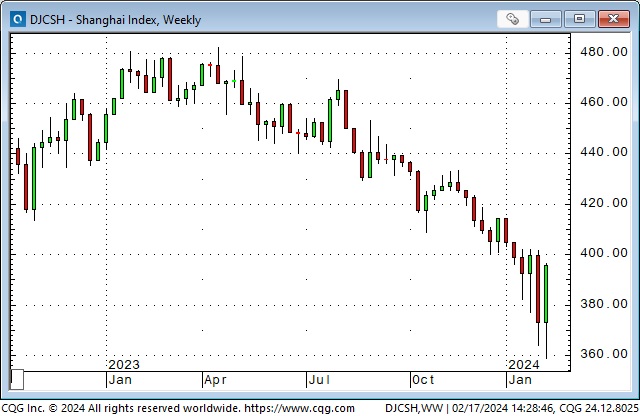
Chinese markets were mostly closed for the New Year holiday this week, but the Shanghai index bounced back from 5-year lows last week.
Currencies
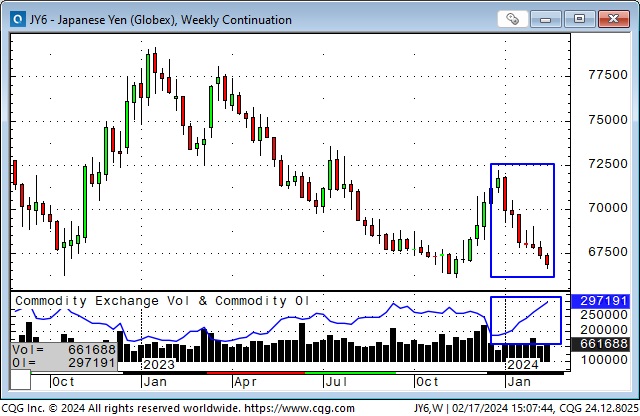
The Yen has fallen for seven consecutive weeks and is just above the 34-year lows it hit last November. Open interest on the CME has increased ~60% (to what may be All-Time Highs) since the turn of the year as speculators ramp up their short positions to near the highest levels of at least the last four years. The weakness in the Yen since late December coincides with 1) the US Dollar’s strength against virtually all other currencies and 2) rising US interest rates (while Japanese short rates remain below zero.) Speculators may be pressing short-side bets on the Yen in the belief that the Japanese authorities will not vigorously intervene to keep the Yen from falling.
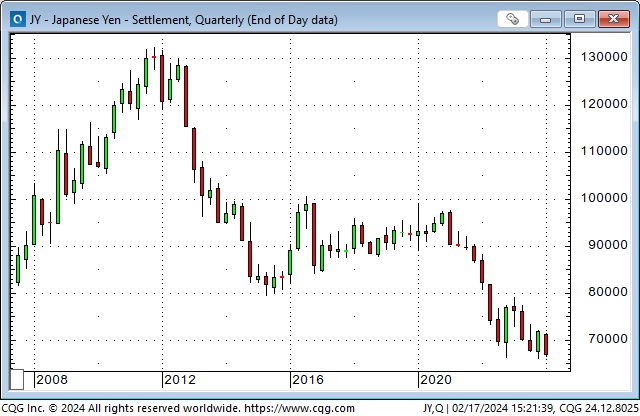
The Yen made All-Time Highs against the USD in 2011/2012 but began to fall from those levels after PM Abe instituted his Three Arrows program to get the Japanese economy out of the malaise it had been in since 1990. The Yen is down ~50% from the 2012 All-Time Highs.
Some sophisticated investors use the Yen as a “funding currency” in “carry trade” speculation. They borrow Yen at ultra-low interest rates (Japanese short rates are currently around minus 0.10%) and invest the funds in higher-yielding assets, for instance, the Mexican Peso, where short-term interest rates are ~11%.
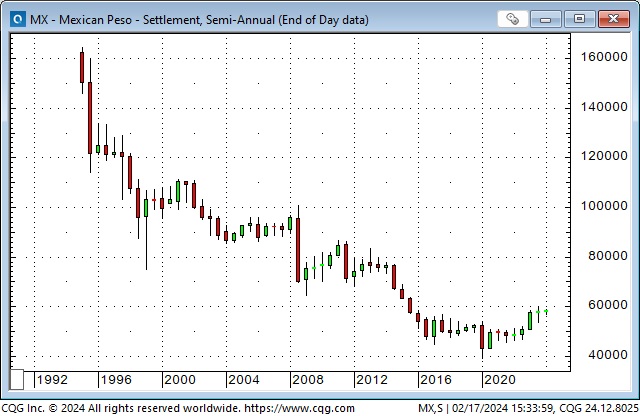
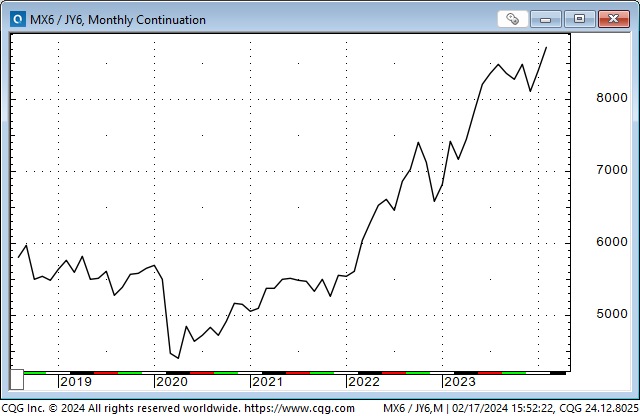
The Mexican Peso declined ~75% against the USD from 1995 to 2020 but has rebounded ~50% from those lows.
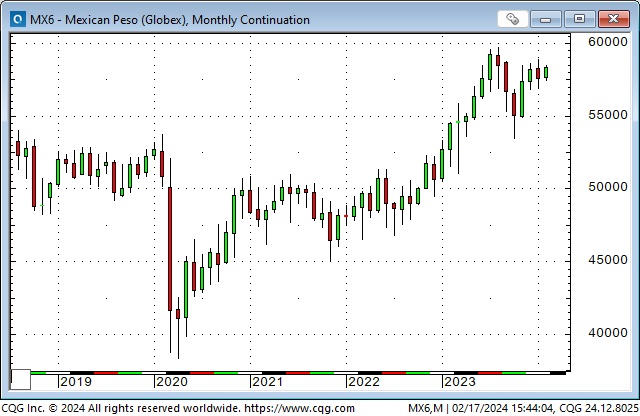
From the 2020 lows to December 2023, price action in the MEX was often highly correlated with the S&P. Since December 2023; the MEX has gone sideways against the USD (while most other currencies have fallen against the USD) while the S&P has made new highs. The net speculative long positioning in the MEX is at its highest since early 2020.
Since 2020, speculators who engaged in the carry trade of borrowing Yen at low rates and investing in the Mexican Peso at higher rates have not only profited from the substantial interest rate differential but have also seen the Peso double against the Yen. Now, imagine that they leveraged that trade! WOW!
Gold
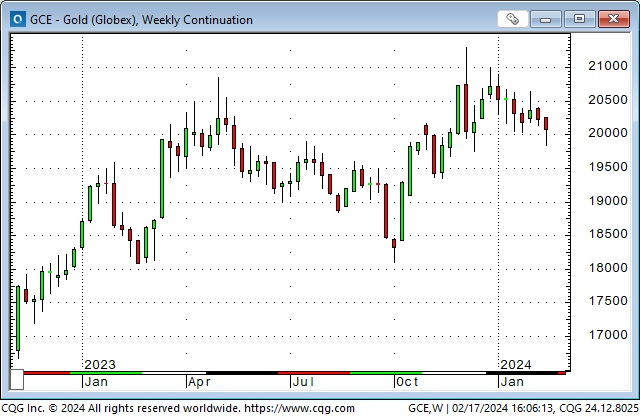
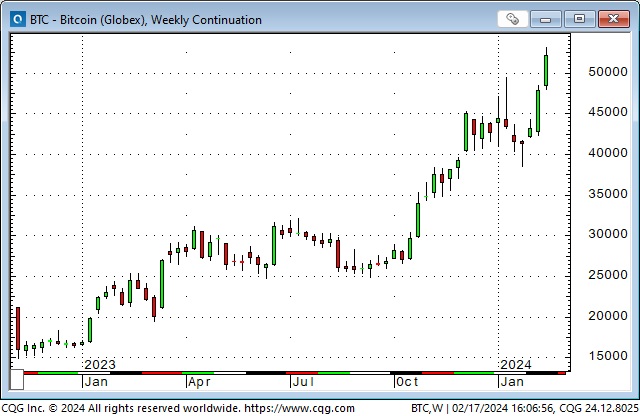
Gold is only down ~5% from All-Time Highs made in December, yet it “feels” ignored as stocks soar and bitcoin doubles in price from the October lows (do you think there is a “bullish sentiment” correlation between stocks and bitcoin?)
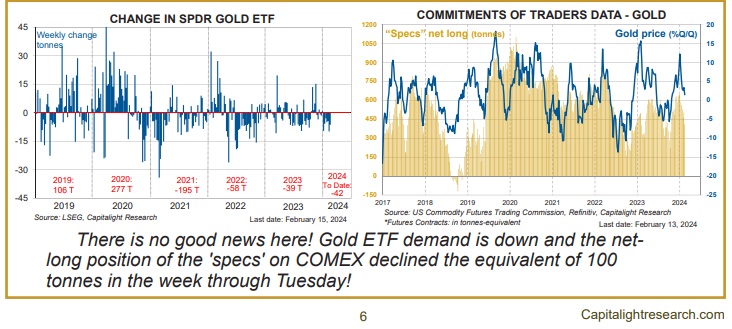
The “ignored” aspect of gold is borne out by the continuing net sales of gold ETFs and, more recently, by the decline in bullish positioning on the COMEX, where open interest has fallen to a 6-year low. These two charts are courtesy of my good friend Martin Murenbeeld. If readers are interested in the gold markets, click here for a free trial of his weekly Gold Monitor, which gold producers and institutional accounts read.
Energy
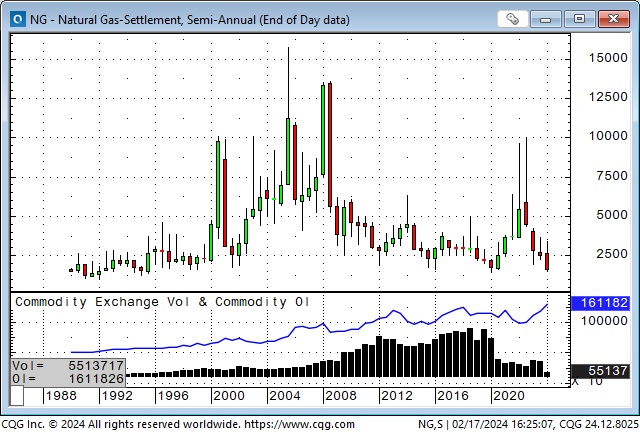
Front-month NYMEX natural gas futures have tumbled >50% in just over a month, with prices now near the lows of the last 30 years. On an inflation-adjusted basis, natural gas is astonishingly cheap! Open interest is at All-Time Highs.
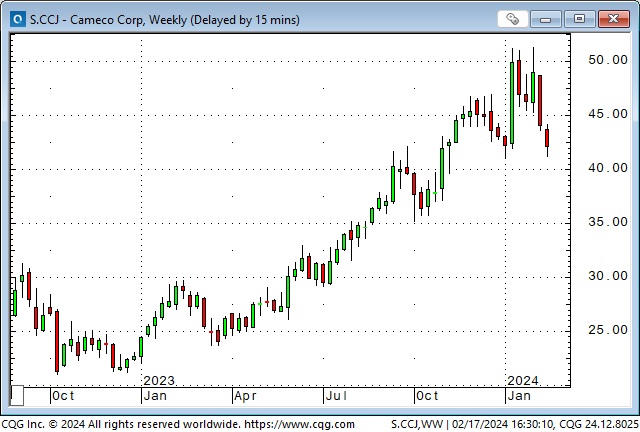
Uranium had a great run on supply/demand issues during 2023 and peaked on February 1, with prices setting back 10 – 20% since then.
Grains
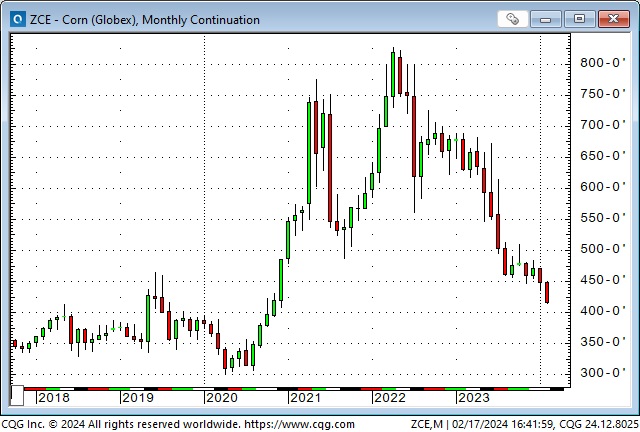
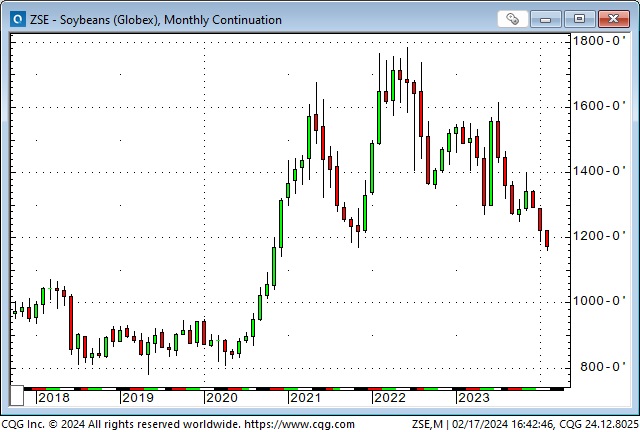
CBOT futures for wheat, corn and soybeans traded near All-Time Highs following the Russian invasion of Ukraine, but prices have fallen dramatically since, with wheat down ~60%, corn down ~50% and soybeans down ~30%.
The net speculative short positions in corn, soybeans, soybean meal and soybean oil are around 4-year highs.
My short-term trading
I’ve done relatively little trading in February, but since the last week of January, I’ve taken a handful of small losses trying to top-pick the S&P and the NAZ. The irony is that I missed the 130-point break in the S&P from Monday’s highs to Tuesday’s lows because “life got in the way.” (I did a road trip to visit an old friend and have dinner with my brother and sister.)
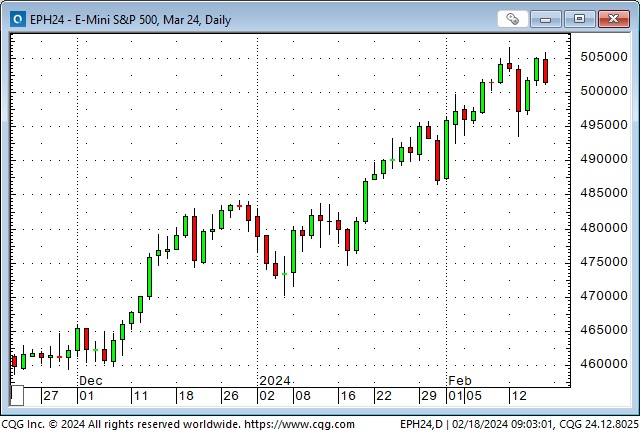
I re-shorted the S&P on Friday (after the market had an All-Time High close Thursday after recovering from the Monday/Tuesday sell-off) and stayed short into the weekend.
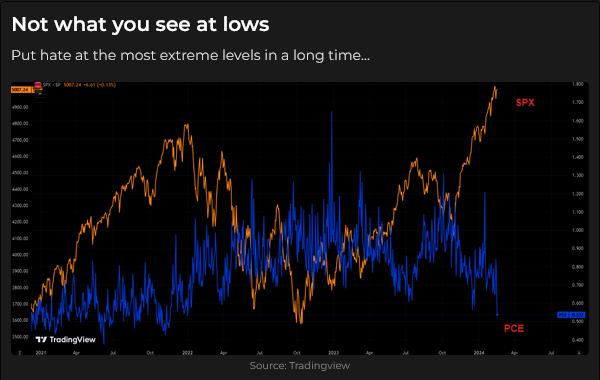
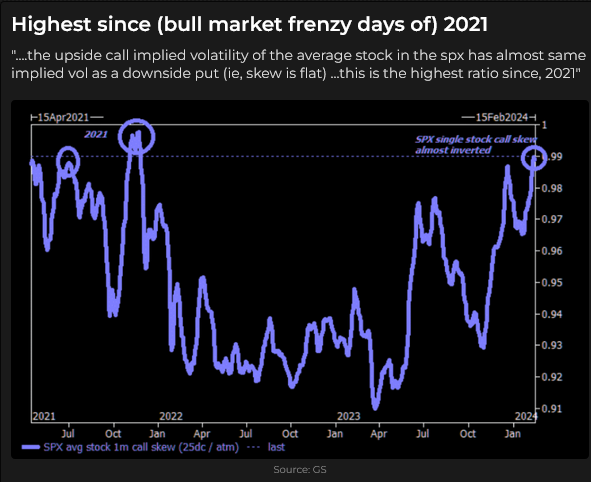
I talked about “why” I’m shorting the stock indices in both of the podcasts noted below but in essence I think sentiment and positioning are very “frothy” and we could see a good correction. I believe equity markets are in a condition of “irrational exuberance.”
On my radar

Quote of the Week
“If you don’t have a Plan B, you don’t have a plan.” David Rosenberg, this week
The Barney report
Here’s Barney patiently waiting for me to finish writing the Trading Desk Notes.

Listen to Victor talk markets
This morning, in my 6-minute talk with Mike Campbell, we discussed the bubbly nature of the stock markets – I said it feels like retail traders are buying lottery tickets in a casino – why people should consider purchasing dirt-cheap puts to hedge their stock portfolios and some of the reasons I think we could see a correction. My interview with Mike starts at the 1 hour 9 minute mark. You can listen to the entire show here.

I also did my monthly 30-minute interview with Jim Goddard on the “This Week In Money” podcast this morning. Jim and I discussed how I feel about the irrational exuberance in the equity markets! We also discussed gold, currencies, interest rates, cocoa, and natural gas. I gave him a 2-minute summary of my speech on the energy markets at the recent World Outlook Financial Conference. You can listen to the interview here.

Online streaming video access to The World Outlook Financial Conference: https://mikesmoneytalks.ca/
The Archive
Readers can access weekly Trading Desk Notes going back seven years by clicking the Good Old Stuff-Archive button on the right side of this page.
Headsupguys
There’s a reason I put a link to Headsupguys in my Notes every week. I’ve had friends who took their own lives, and Headsupguys helps men struggling with depression.

Subscribe: You have free access to everything on this site. Subscribers receive an email alert when I post something new – usually 4 to 6 times a month.
Victor Adair retired from the Canadian brokerage business in 2020 after 44 years and is no longer licensed to provide investment advice. Nothing on this website is investment advice for anyone about anything.


