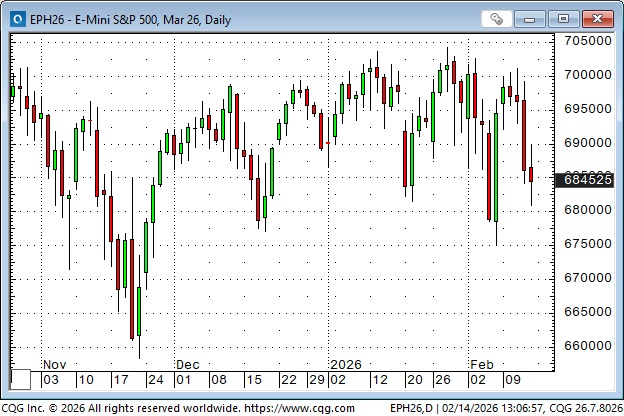
The S&P 500 Index is drifting sideways while some sectors soar and others tank
S&P futures have chopped sideways within a 200-point range since November. They traded to a record high above 7000 on January 28 (the day gold and silver had record high closes), but subsequent rallies have reversed lower.
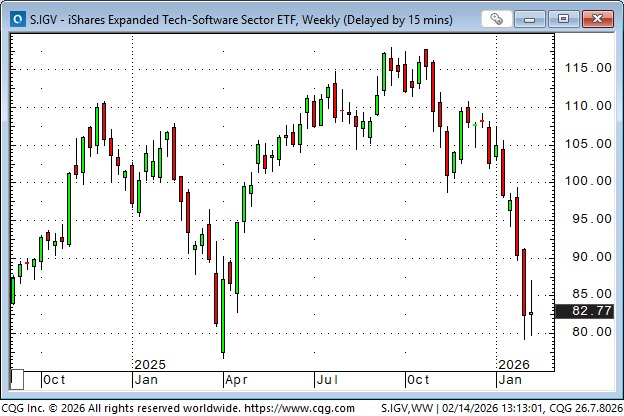
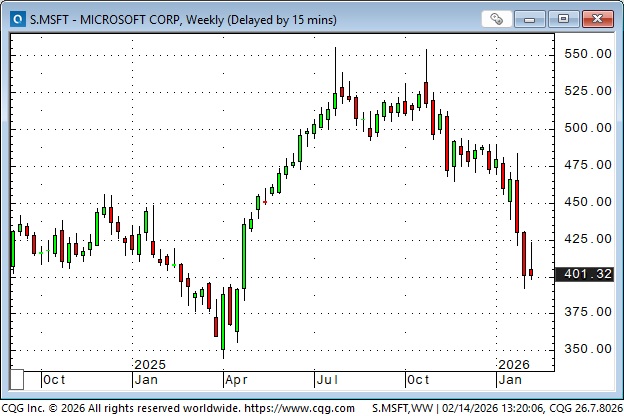
While the S&P drifted sideways, questions about AI prompted a “re-evaluation” of the tech-software sector.
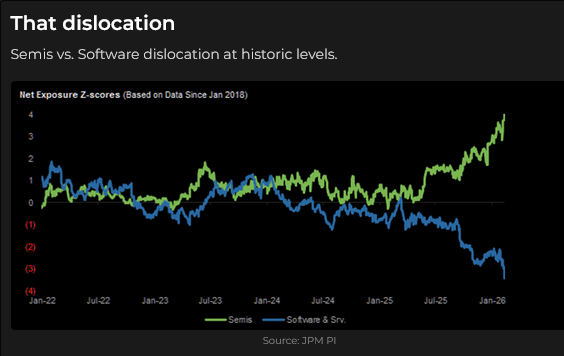
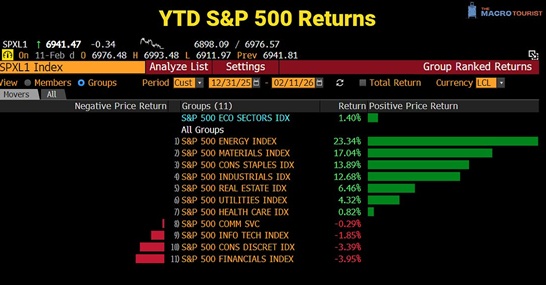
The energy sector was also hit with a “re-evaluation” as capital “rotated” from sector to sector.
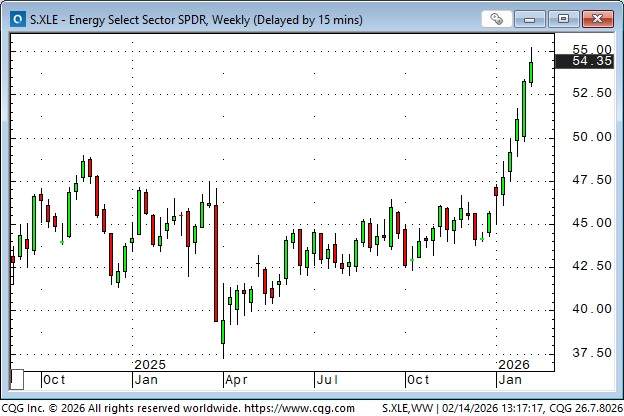
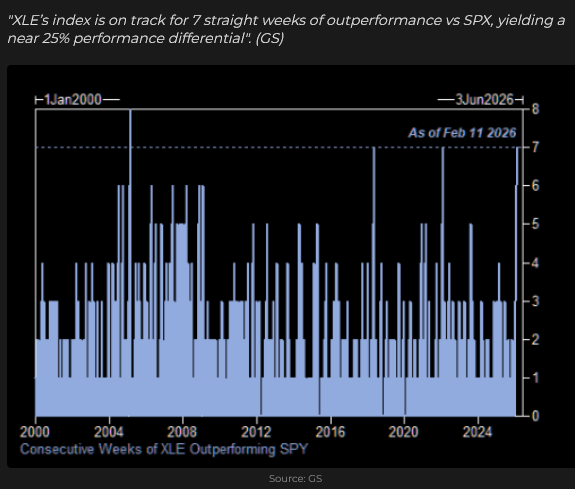
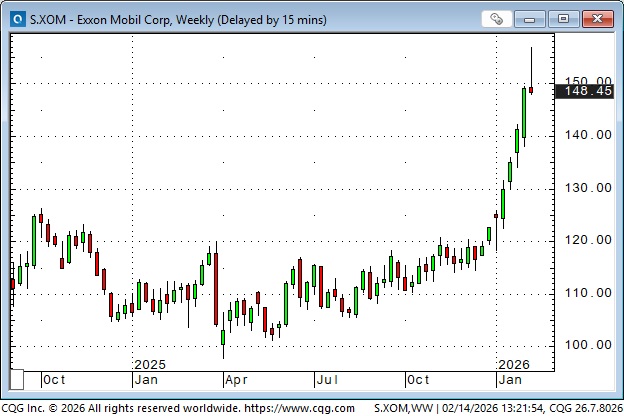
The energy sector has the best YTD performance.
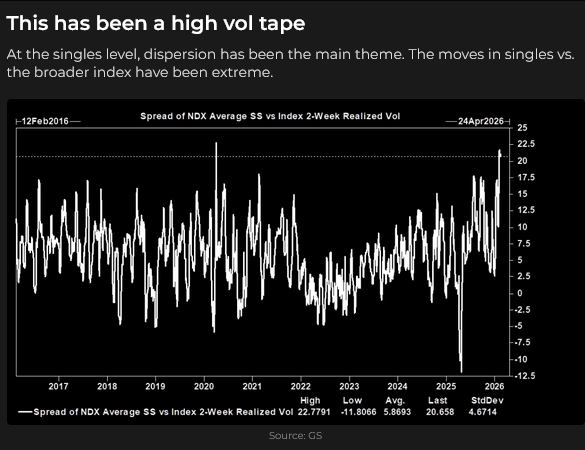
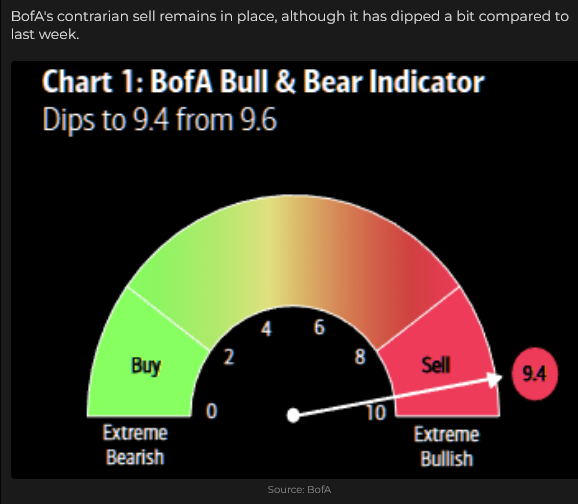
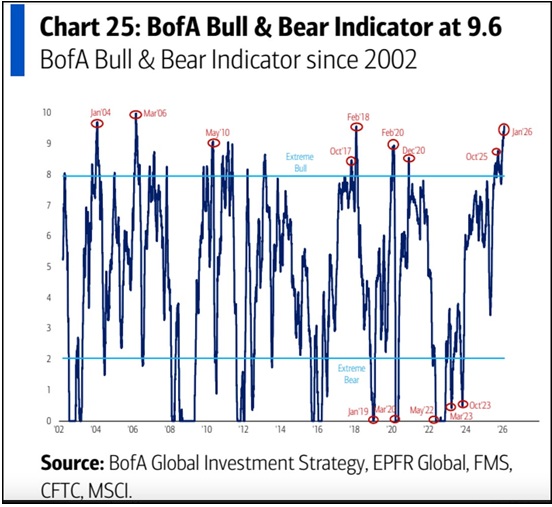
Despite the “dispersion” between the S&P index and its sectors, retail sentiment has remained very bullish. Margin debt is at record highs.
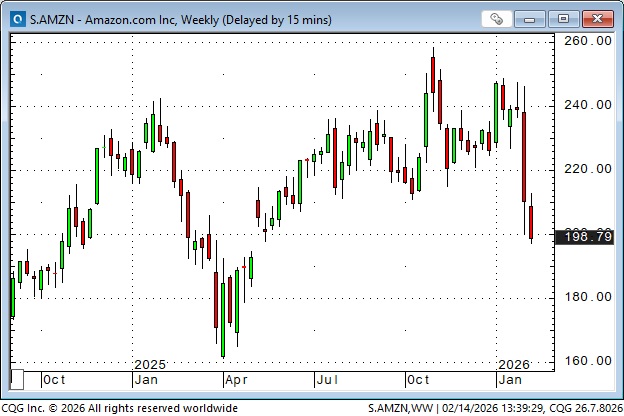
AI was the “driving force” that took the S&P higher for most of 2025, but lately, questions about future viability have dimmed the halos atop former market darlings.
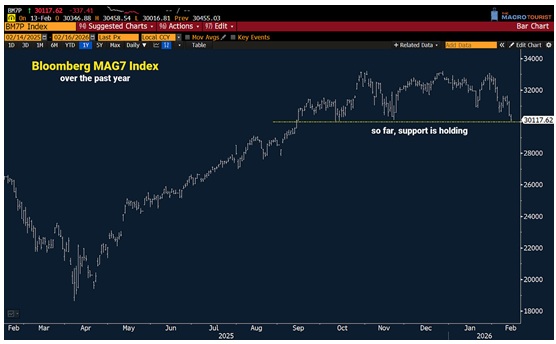
AMZN has lost nearly $500 billion in market cap over the past 9 trading days.
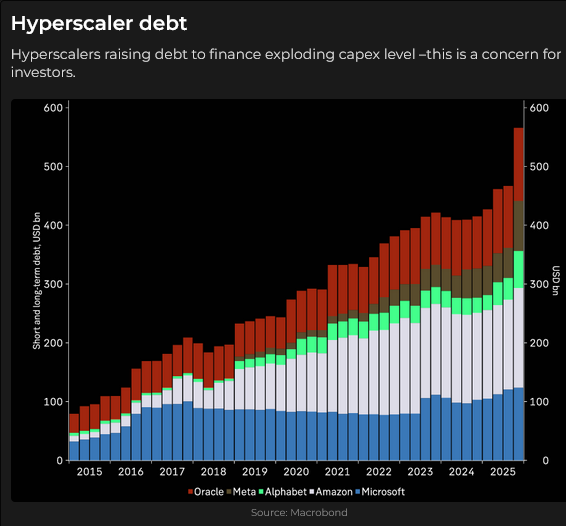
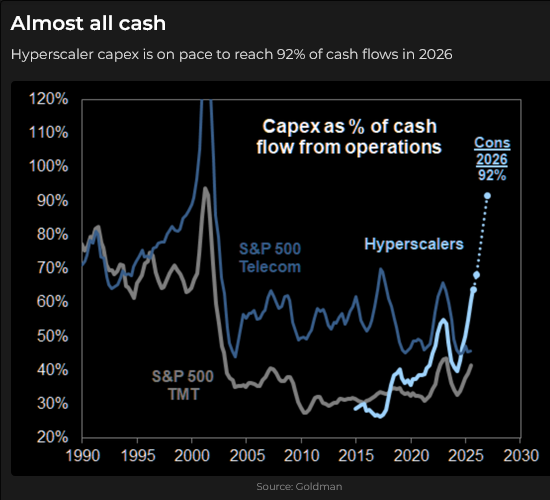
AI is generating lots of questions as capex estimates soar to $700B+. Will there be an ROI? Will there be demand? Will there be enough electricity to run the data centers? If Hyperscallers are spending all their free cash flow (and more) on capex, will they continue with share buybacks? In 2025, big-cap tech buybacks totalled ~$300 billion. Will AI cause deflation? Who wins and who loses in the AI race?
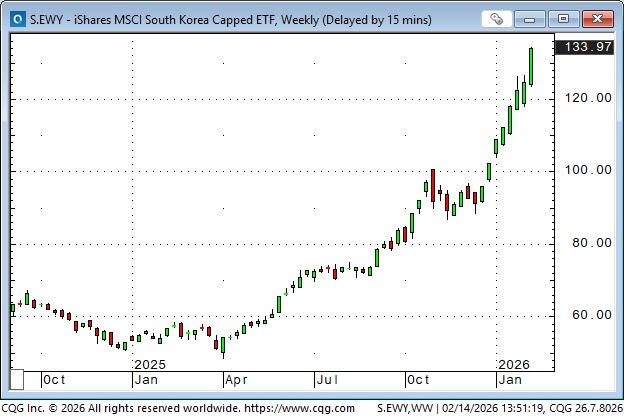
While the multi-year advance in the S&P has stalled over the past several weeks, other indices have been hitting new record highs, with the South Korean market the top performer.
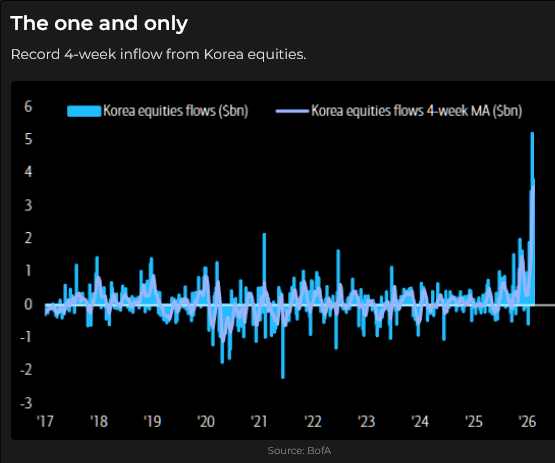
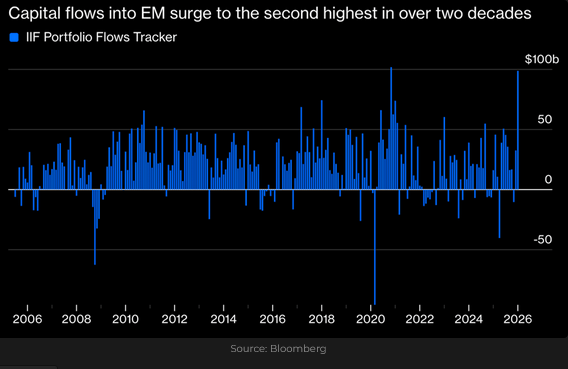
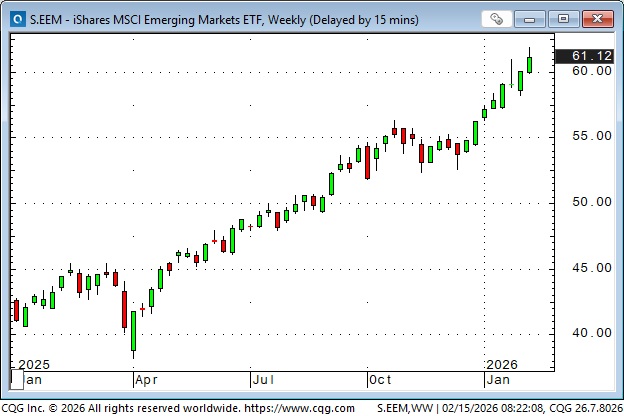
Remember the famous quote from Don Coxe: “Emerging markets are markets you cannot emerge from in an emergency.”
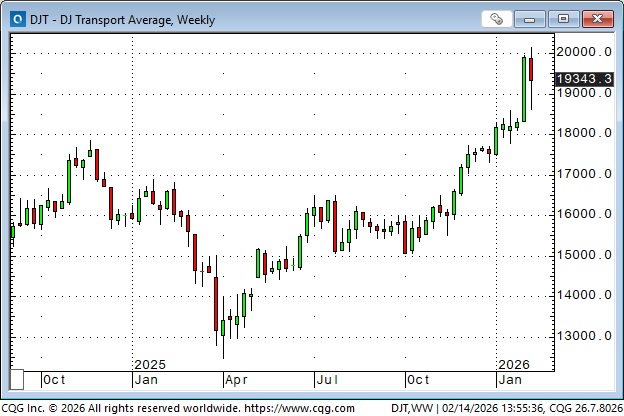
The Dow Jones Transportation Index has rallied ~60% from the Liberation Day lows.
Currencies
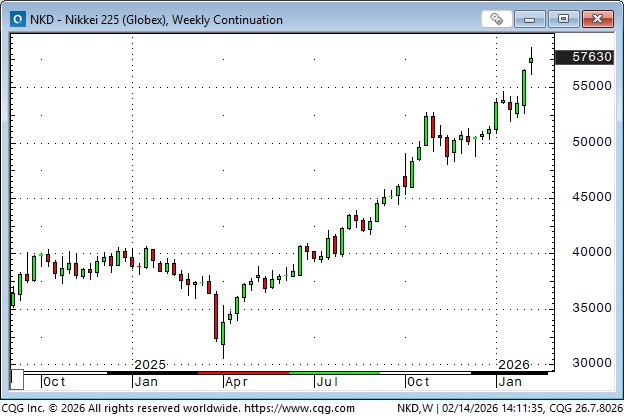
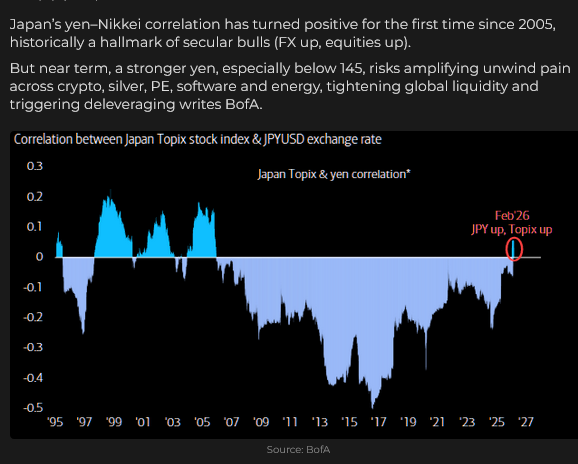
Takaichi won a super-majority in the February 8 election. Markets delivered a solid “Buy Japan” response; the Japanese stock market rallied to record highs, while bond prices and the Yen also rose.
The Nikkei is up ~92% from its lows on Liberation Day.
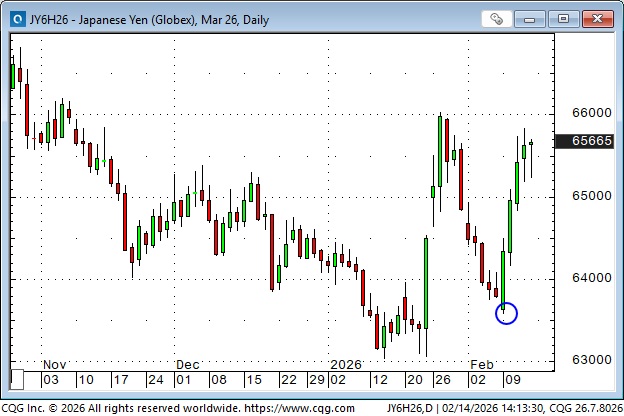
Yen up vs the USD since the election.
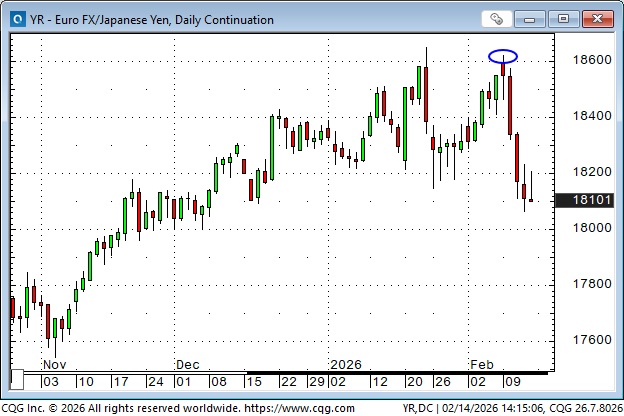
Euro down Vs the Yen since the election.
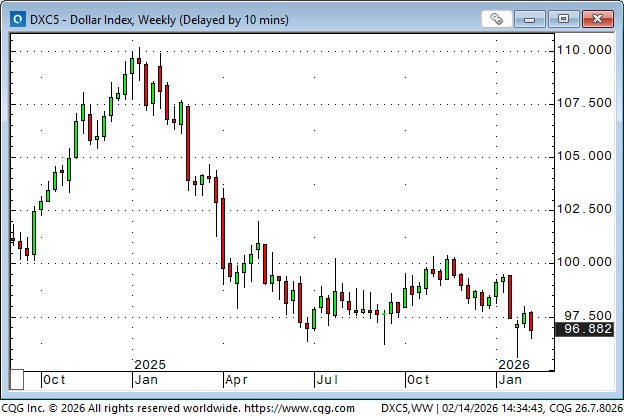
The DXY US Dollar Index briefly touched a 4-year low on January 27 (as the Euro and British Pound briefly traded at 5-year highs). Net capital inflows to the USA in 2025 were ~$1.6 trillion, with ~$700 billion into US equities. Foreigners hold ~$70 trillion of US assets, up ~50% over the past 10 years. (As I like to say, capital flows to the USA for safety and opportunity). This capital has been rewarded as American equities have outperformed the ROW (rest of the world) by a wide margin since the GFC. Still, there have been “rumblings” about possible repatriation or (at least) some increase in hedging currency exposure, which would weigh on the USD.
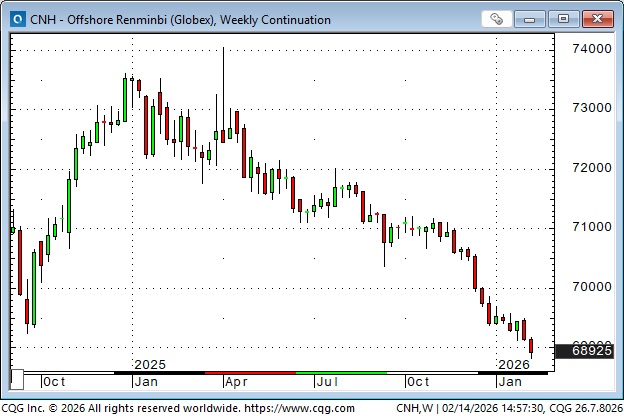
The Chinese RMB has rallied to a 3-year high against the USD, which may provide “room” for other undervalued Asian currencies to rally against the USD. I say “room” because all Asian currencies are undervalued against the USD due to mercantilist polices which facilitate exports to the USA. Asian countries compete with each other to export to the USA, and any country whose currency rises while other Asian currencies remain low would lose market share. China is the “big dog” in terms of market share. If the RMB rises (Xi apparently wants a stronger currency befitting China’s status as a leading global power), then other countries can follow China’s lead, without losing market share. (Lower prices in this chart mean that it takes fewer RMB to buy a USD.)
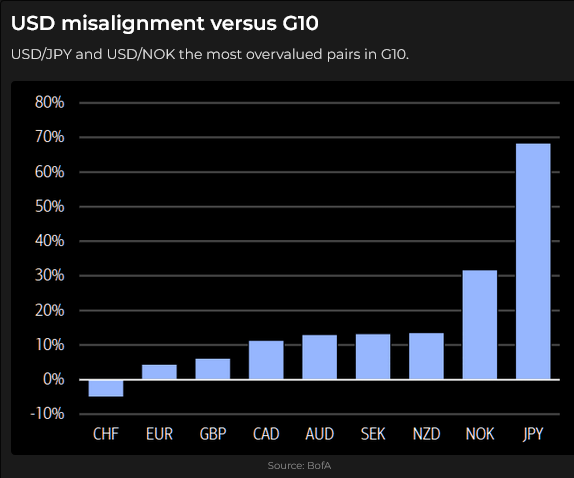
Most of the world’s currencies (save the Swiss Franc) are undervalued vs the USD, especially Asian currencies.
Precious metals
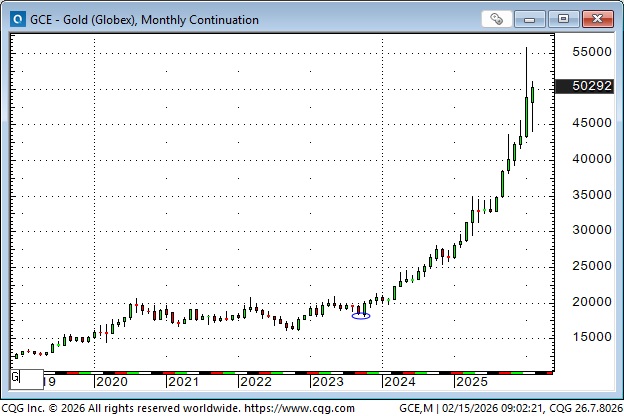
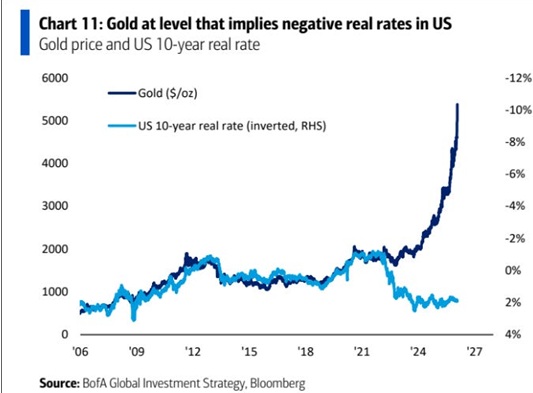
Comex gold rallied above $2,000 (to ~$2080) following the Russian invasion of Ukraine in early 2022. Most gold analysts believe that the freezing of Russian assets in retaliation for the invasion is the reason that various central banks, especially the PBOC, substantially increased their gold purchases. The central banks’ buying “put a floor” under the gold price, as people believed the banks would continue buying regardless of price (they wanted gold in their vaults – they were not speculating on the price).
Having a solid bid under the market emboldened speculators, and gold prices soared. The “debasement trade” (governments are destroying the purchasing power of fiat currencies with relentless fiscal deficits) provided an excellent rationale for extending the rally, and the uptrend went parabolic, with Comex futures rising above $5,580 in January, up ~$3,775 from the October 2023 lows made before the Hamas attack on Israel.
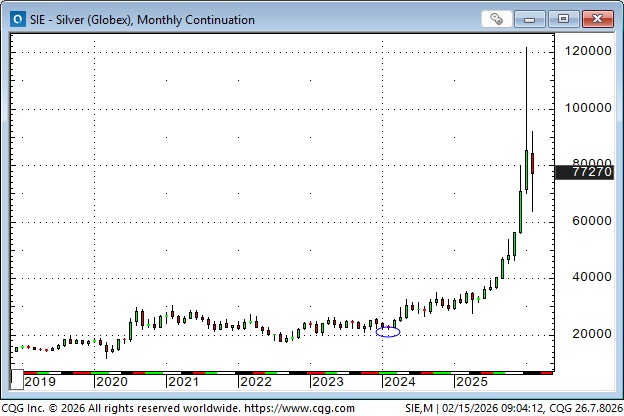
Silver’s parabolic rise was even more spectacular than gold’s, with prices rising from ~$22 in January 2024 to ~$122 in January 2026.
Gold bulls believe the market got “overbought” due to speculative excesses, and is now in a “correction phase” before heading much higher. They argue that the “debasement trade” will only get worse as governments try to inflate their way out of debt. They may be right, but, as a trader, I have to consider the possibility that the “blow-off top” in January 2026 is very similar to the “blow-off top” in January 1980.
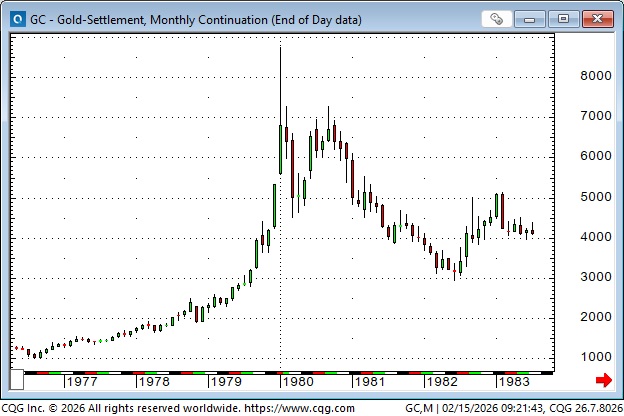
I started trading gold in 1974 when it was ~$100. It rallied to ~$200 ahead of January 1975, when Americans were once again allowed to own gold, but after the law changed, Americans showed little interest in owning gold, and prices returned to ~$100 by mid-1976. I became a futures broker in 1976 and participated in the spectacular rally that saw the price soar from ~$220 in January 1979 to ~$850 twelve months later. The narrative back then was that gold was a hedge against inflation/stagflation (which had been rampant in the 1970’s), and I remember seeing long lineups of people outside the Bank of Nova Scotia waiting to buy gold coins or bars.
When gold and silver broke from their January 1980 highs, the bulls were adamant that it was only a correction and that the rally would resume. But it didn’t; the world had changed (Google: Volker interest rates), and it would be decades before the precious metals made new highs.
Interest rates
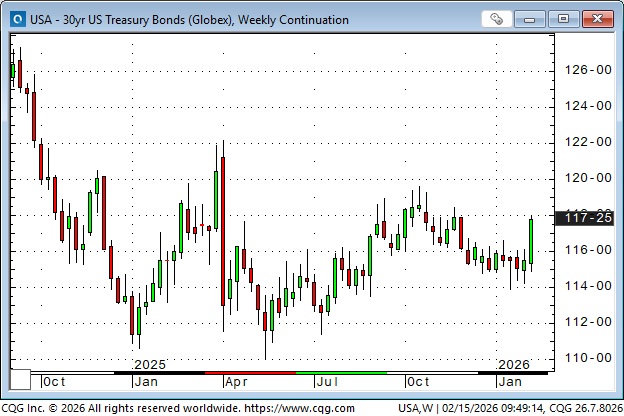
The market currently expects the US Government to run fiscal deficits of more than $2 trillion per year, with debt service costs exceeding $1 trillion per year, and bond prices are rising with yields at 3-month lows. Why is that happening?
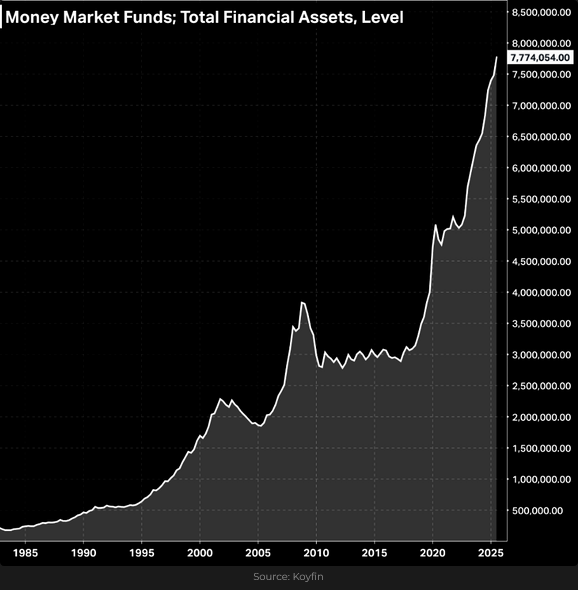
Total assets in US money market funds have soared to record highs. I remember when people thought all that “dry powder” in money market funds would finally see the “writing on the wall” and pile into the stock market, driving prices to the moon.
My short-term trading
I shorted the S&P on Wednesday, February 4, before travelling on Thursday to attend the World Outlook Conference. The market sold off hard on Thursday and closed at a 2-month low. I lowered my stop (before going to bed) to lock in gains and was filled overnight when the market began a sizzling rally. Rock and Roll!
I was back on the short side of the S&P (and the CAD) this week, and closed out those trades for modest gains.
I rely on my intuition to get a “feel” for the market, and attending the conference seemed to throw it out of whack, so I didn’t press my luck this week and was flat going into the weekend.
The World Outlook Conference
The conference was probably the best one we’ve had over the past 40 years. We had terrific speakers with an amazing range of topics and opinions. Click here to buy a video of all the main stage speakers.
I loved the opportunity to hear the amazing range of topics and opinions and to visit with old and new friends. Here’s a photo of me with Kevin Muir and Tony Greer!

The Barney report
Barney was happy to see me after “Papa” had been away for four days. We got back into our routine on Monday morning, taking our first walk of the day as the sun peaked over the horizon. Here he is now, waiting patiently for another walk after I finish writing the Notes.

Listen to Mike Campbell and me discuss markets
On Saturday’s Moneytalks show, Mike and I discussed the wild price action in different sectors of the stock market while the broad indices went sideways. The “AI” story led the indices higher in 2025, but lately, the market has been questioning previous expectations – and some stocks have tumbled. You can listen to the entire show here. My spot with Mike starts around the 56-minute mark.

The Archive
Readers can access any of the weekly Trading Desk Notes from the past five years by clicking here.
Subscribe: You have free access to everything on this site. Subscribers receive an email alert when I post new content, typically four to six times a month.
Victor Adair retired from the Canadian brokerage business in 2020 after 44 years and is no longer licensed to provide investment advice. Nothing on this website is investment advice for anyone about anything.