With the NAZ down ~12% since the July 11 record highs, do we bounce or keep falling?
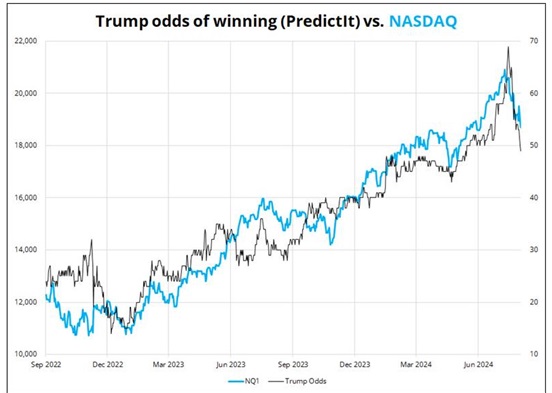
The NAZ closed lower for four consecutive weeks and closed this week at 18500 (which may be an essential support level), the lowest close since May 14.
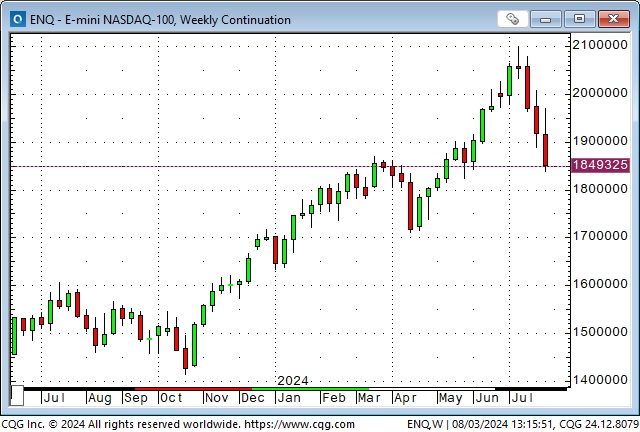
Perspective: At the July 11 highs, the NAZ was up ~20X from the 2009 lows, 200% from the 2020 lows, ~100% from the 2022 lows, and 50% from the 2023 lows. Indeed, some degree of mean regression was due.
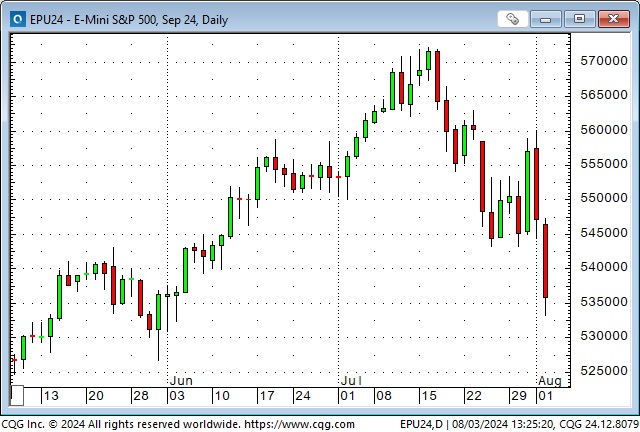
The S&P futures are down ~6% in three weeks from their record highs, but the market fell ~4.5% from Thursday’s high to Friday’s close. Friday’s volume and this week’s volume are the highest (daily and weekly) since at least October 2022 (X delivery spikes.)
Last year, I wrote that the market would see a rate cut from the Fed as a “green light special” to buy stocks. That’s history, as the market has shifted to worries that a Fed cut signals a lack of growth. Bad economic news is now bad news for stocks.
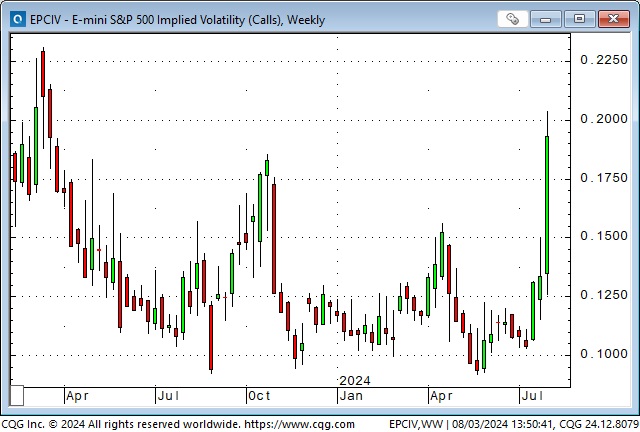
S&P option VOL has doubled from the complacent levels of mid-July to levels not seen since the SVB banking crisis in March of 2023.
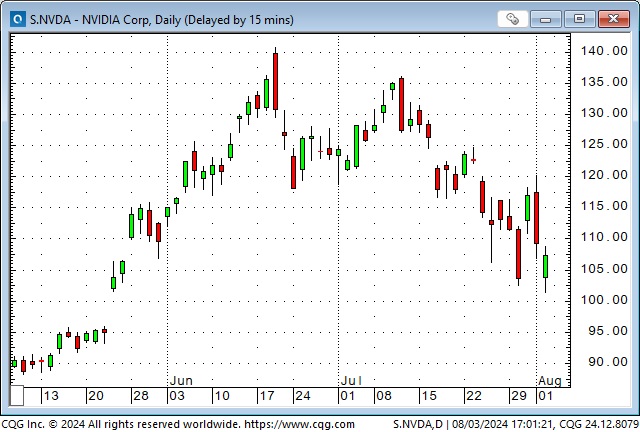
NVDA is down ~29% (and over a trillion dollars in market cap) from its June 20 highs as enthusiasm for anything and everything related to AI wanes.
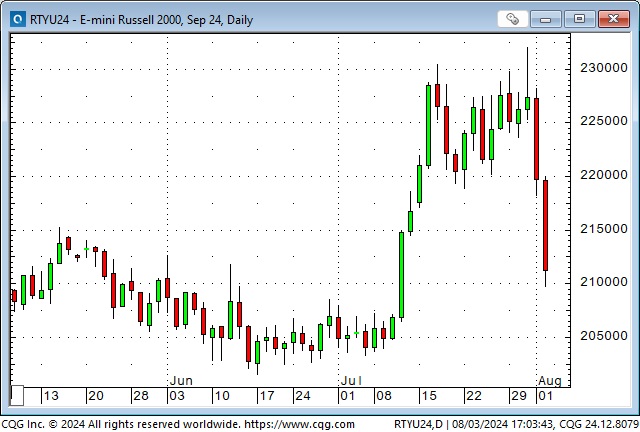
The “rotation” into small caps that began on the July 11 Key Turn Date ran out of steam this week.
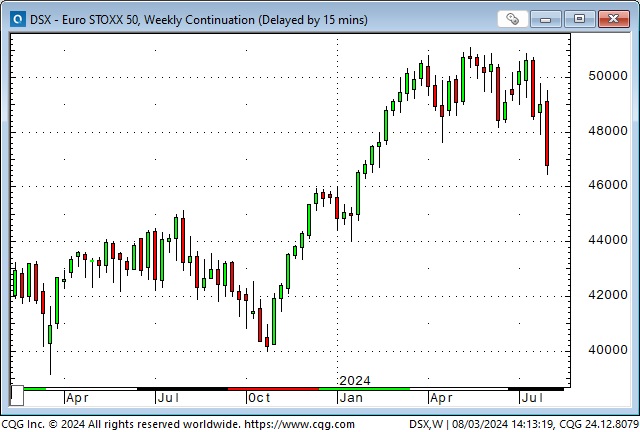
The Euro STOXX 50 (a European benchmark) tumbled this week to the lowest close since January.
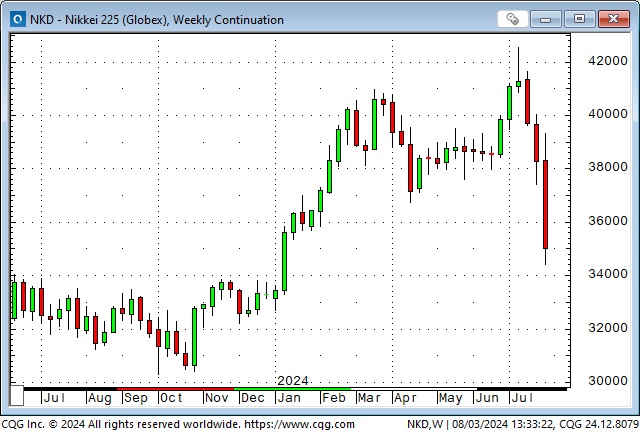
The Japanese Nikkei futures have dropped nearly 18% from their July 11 record highs, with more than half of that decline coming on Thursday and Friday. The index had its lowest weekly close since January.
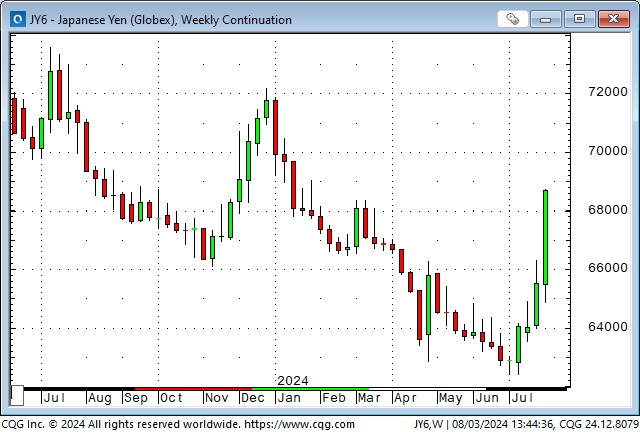
The Yen fell to 35-year lows on July 11 (CPI day) but rallied after Japanese authorities intervened. The intervention ignited short-covering, and the Yen has rallied ~10% from the lows. The BoJ raised short Yen rates to 0.25% (a 15-year high!) at their scheduled August 1 meeting.
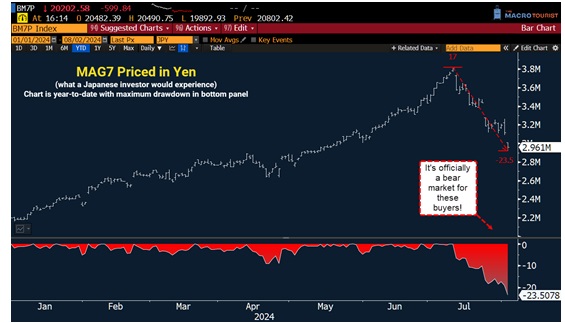
Here’s a chart from Kevin Muir. If an investor sold Yen to buy US Dollars and used that money to buy the Magnificent 7 one month ago, his unrealized losses (if he wanted to sell the shares and convert the proceeds back to Yen) would be about 24%! Yikes!
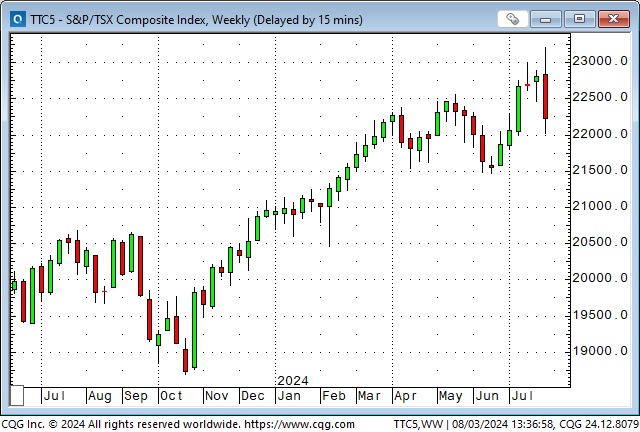
The Toronto composite hit a record high on Wednesday (month-end and Fed day), then fell ~5% to Friday’s lows, creating a weekly key reversal down.
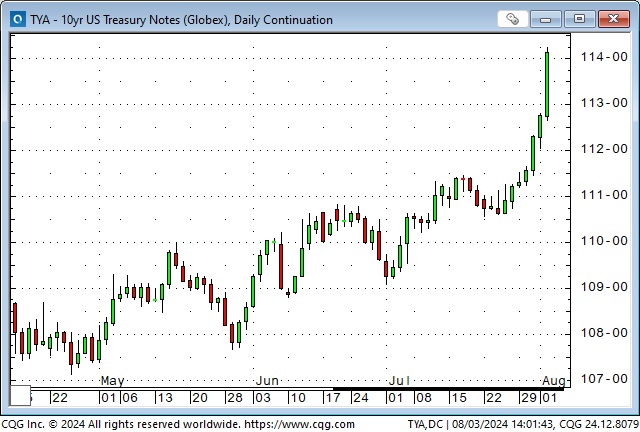
10-year Treasury futures had their biggest weekly gain in over two years this week as the Fed acknowledged that the “full employment” part of their “dual mandate” is becoming more critical as “price stability” becomes less of an issue. Friday’s weaker-than-expected NFP report accelerated the rally as the market saw increasing odds of a recession.
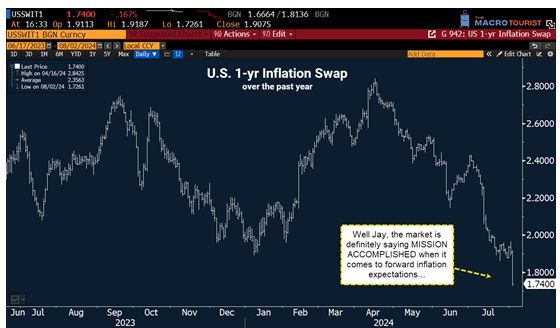
This chart from my friend Kevin Muir (The Macrotourist) shows how inflation isn’t the problem it used to be.
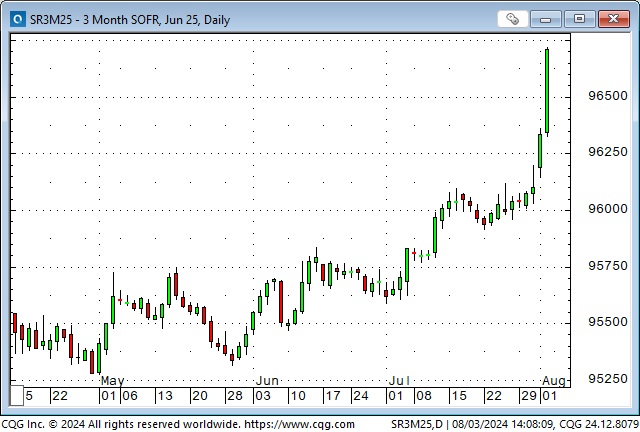
The short end of the curve rallied hard this week as the market changed from anticipating a “higher for longer” Fed (in late May) to expecting the Fed to slash rates by ~100bps by yearend and by ~200bps by June 2025.
Currencies
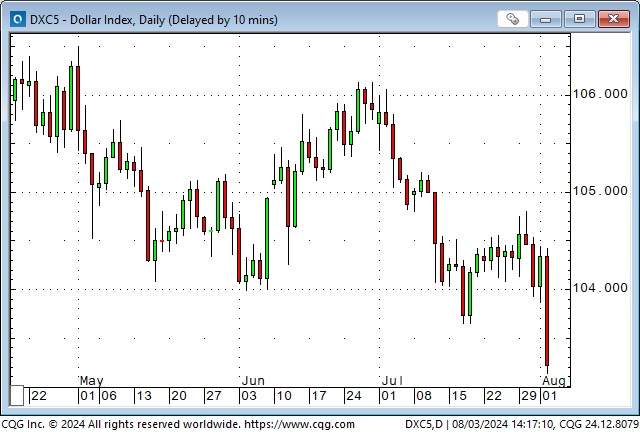
The US Dollar Index tumbled to a 5-month low this week, with most losses coming after Friday’s NFP report.
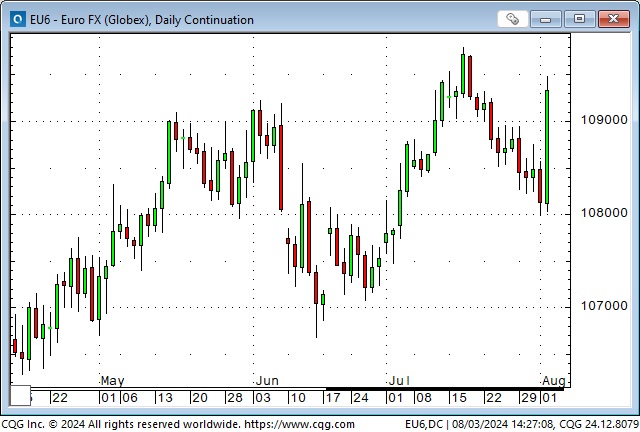
The Euro had its biggest one-day rally on Friday since November 14, 2023 (when it rallied 200 bps on a weaker-than-expected US CPI report).
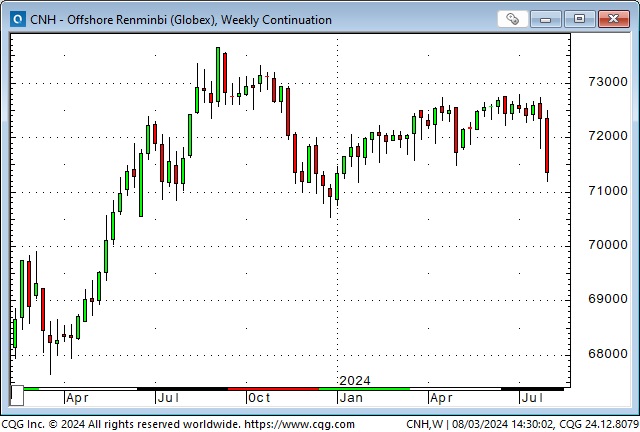
Asian currencies (led by the Yen) rallied on Friday. In this chart of the Chinese currency, a lower number means it takes fewer RMB to buy a USD.
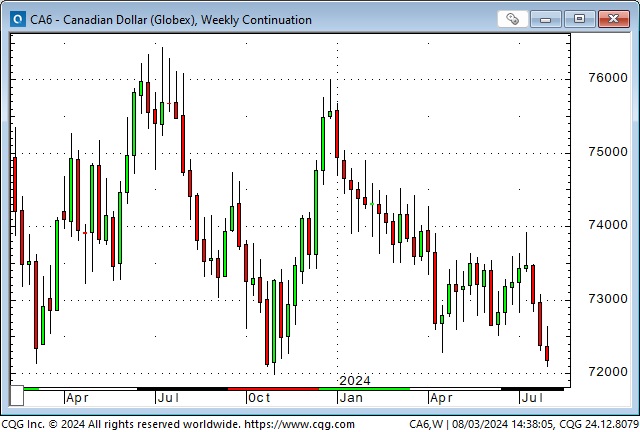
The Canadian Dollar had its lowest weekly close since October this week ( it was just ten ticks away from the lowest close in four years.) At the 2-year tenor, Canadian rates are ~70bps below US rates. Net short speculative positioning in CAD futures surged ~30,000 contracts this week to a new record high of ~196,000 contracts as of July 30. Each contract is for CAD$100,000.
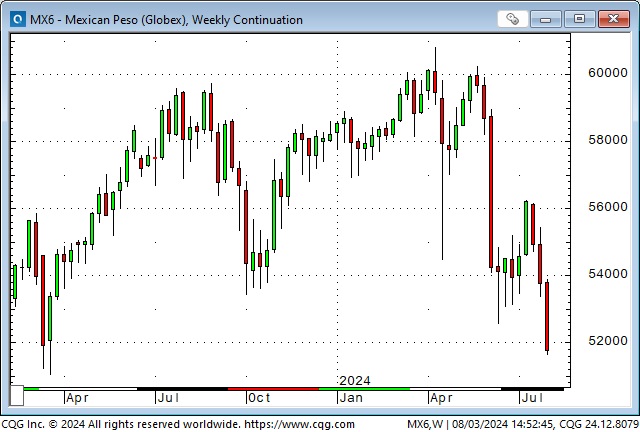
The Mexican Peso fell again this week. The MEX had been the strongest currency in the world (?) for the past four years after recovering from tumbling to record lows against the USD in March 2020. It was buoyed by high interest rates, which made it the famous recipient of carry trade flows. (I’ve written several times about the fantastic gains in the short Yen / long Peso carry trade.)
The Peso hit 9-year highs in April but dropped like a stone when the Japanese authorities launched their first intervention. It rallied back to the May 20 highs (May 20 was a key turn date across several markets and may have been the “high water” mark for “risk on” speculative activity. See more below.) It took another leg lower before and following the Mexican election (see the June 8 TD Notes for more detail.)
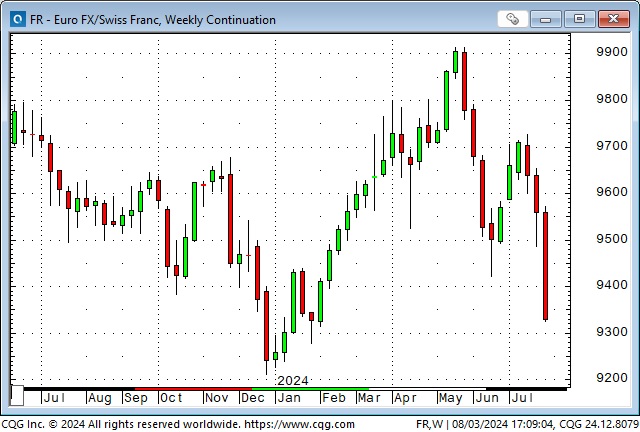
My favourite barometer of “European stress,” the Euro/Swiss spread, turned decisively to “rising stress” the week of May 20 (there’s that date again), bounced in late June, but has signalled even greater stress the last three weeks.
Gold
Comex gold futures rallied ~$110 from Monday’s low to Friday’s high. Mid-east geopolitical stress buoyed the market mid-week, and the weak USD and sharply lower interest rates gave it another leg higher on Friday. However, after coming within ~$15 of making new record highs, gold dropped ~$70 (in one hour) mid-day Friday, only to bounce back to close nearly unchanged to Thursday’s close.
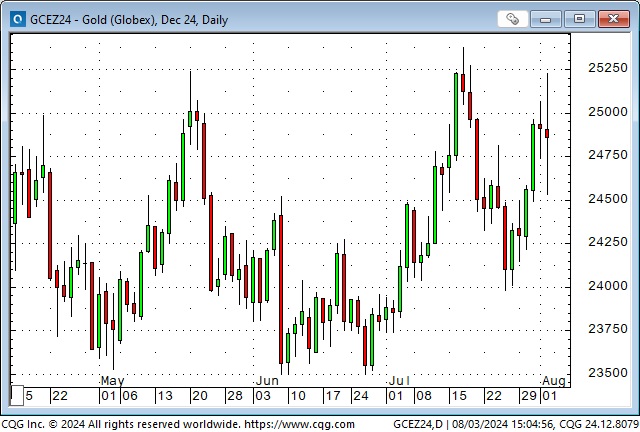
Friday’s mid-day break in gold came precisely when the S&P (my favourite risk barometer) broke to 6-week lows. I’ve previously written that the May 20 highs in gold (there’s that date again) were created by massive buying by levered speculators on the Shanghai exchange. (Look for comments by Ross Norman over the past two months on his website for excellent coverage of Chinese speculative activity.) COT data shows that net long gold speculative positioning has recently been the highest since the Russian invasion of Ukraine. (COT data as of July 30 shows net short speculative positioning has declined ~10% from July 16 28-month highs.)
The Friday break in gold illustrates a vulnerability – if risk assets continue to fall, leveraged gold speculators may (have to) become sellers. The ~$30 rally back from Friday’s lows may have been a hedge against more geopolitical stress over the weekend.
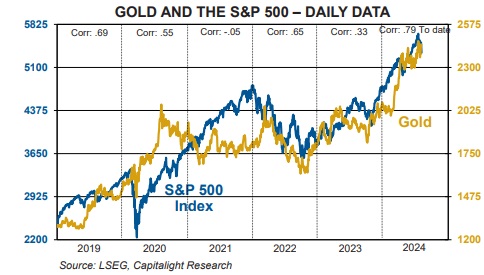
This chart from gold analyst Martin Murenbeeld shows the correlation between gold and the S&P.
Energy
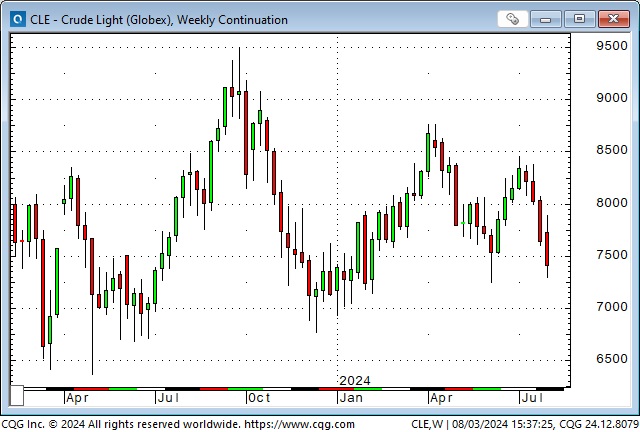
Front-month Nymex WTI futures had their lowest close this week since January, down ~$10 (12%) from early July highs. The market received support from Middle Eastern tensions but succumbed to concerns over falling global demand.
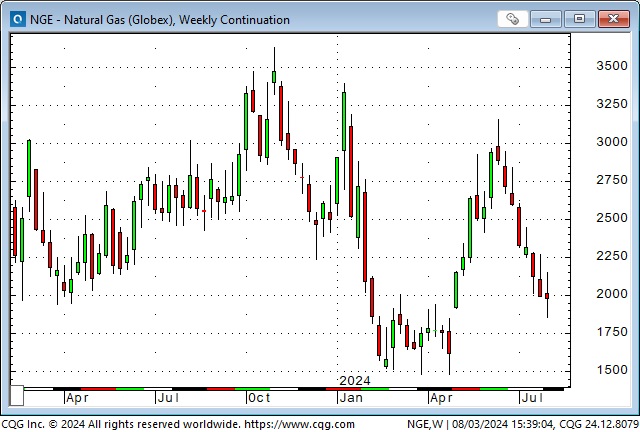
Natural gas futures continued to trend lower.
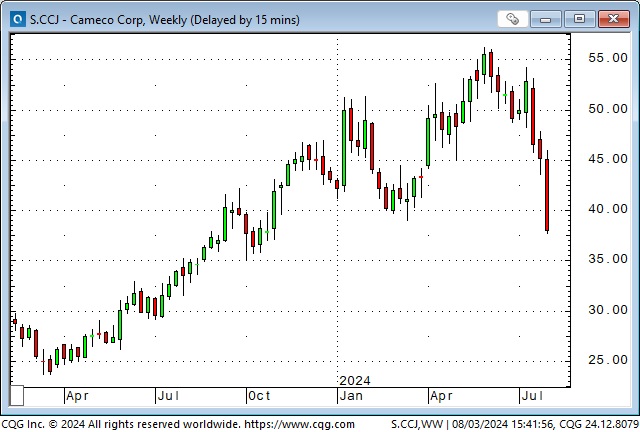
Uranium plays had a great run since 2022 but peaked in late May (there’s that date again) and have trended lower, especially in the past three weeks, as speculative buyers turn sellers.
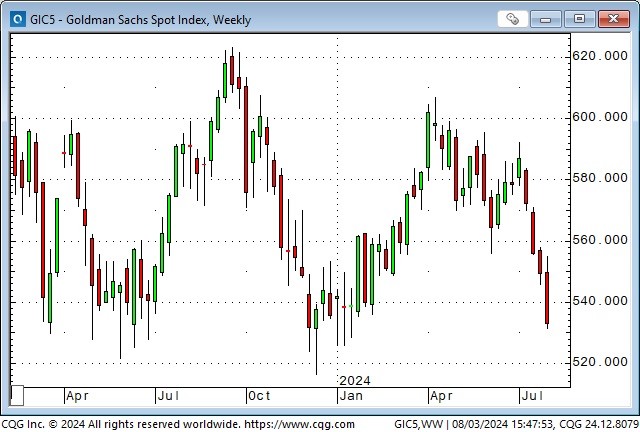
The (energy-heavy) Goldman Sachs commodity index is down ~12% from April highs and had its lowest weekly close in nine months.
Copper
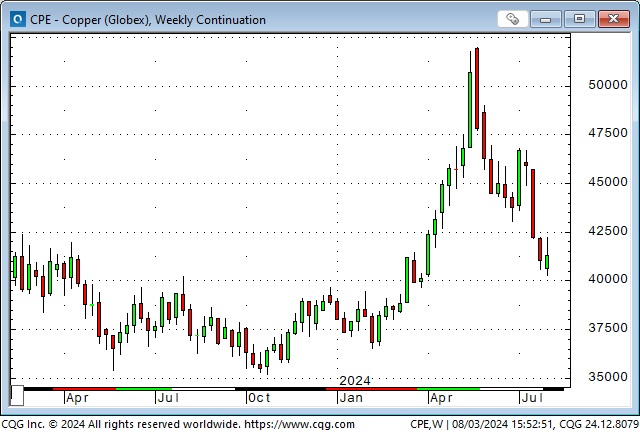
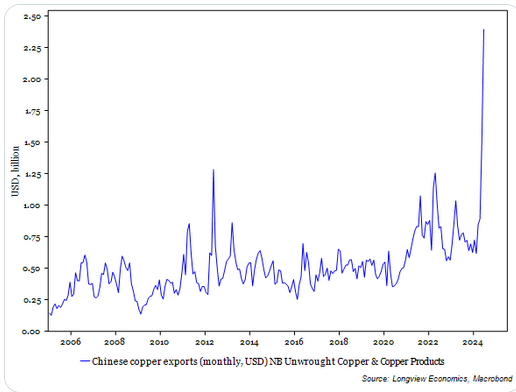
Comex copper futures reached all-time highs of ~$5.20 on May 20 (there’s that date again) but were down ~23% at this week’s lows. Chinese speculators on the Shanghai exchange were aggressive buyers into the highs. Massive exports from China (relative to historical export levels) likely contributed to the price decline.
The Key Turn Date during the week of May 20
For decades, I have examined a wide variety of market correlations for clues about sentiment and positioning. I believe that markets are interconnected and that sentiment and positioning in one market will affect other markets. For instance, if speculative fever is intense in one market, it will have some impact (to varying degrees) on other markets. I also believe that a correlation breakdown (thank you, Jason Shapiro, for giving it a name!) between markets sends valuable trading information.
When several markets reverse course on or around the same date, I define that as a Key Turn Date (KTD). It signals a (profound) change in market sentiment/psychology/positioning.
In my July 20 TD Notes, I wrote about the KTD on July 11, when the US CPI report hit the markets. That was also the day the Japanese authorities intervened in the FX markets, and the Yen turned higher from 35-year lows. The NAZ rallied to record highs on July 11, then turned lower and is now down ~12% from the highs.
I believe that speculative sentiment across various markets may have peaked in the week of May 20. Some markets made decisive turns that week (DJIA, gold, copper, silver, Mexican Peso, EUR/Swiss), and others, like the S&P or the NAZ, only made modest turns and continued trending higher until the July 11 turn date.
My short-term trading
I started this week flat, with no open trades. I was concerned (as I noted in the On My Radar section of last week’s notes) that market volatility could be wild given all the scheduled economic reports, central bank meetings and corporate reports. I also felt the market was ripe for unscheduled geopolitical stress. I decided to assume a semi-summer vacation frame of mind.
Price action was indeed wicked. On Monday, I took short positions in the S&P and was stopped for slight losses before Tuesday’s decline.
I bought OTM gold puts near the close on Tuesday as a limited-risk bet that the mid-east events would not lead to a broader war. The market went against me Wednesday and Thursday on the assassination in Iran, but I was “money ahead” at Friday’s lows as gold VOL jumped. I held the trade into the weekend.
I bought the Canadian dollar on Wednesday as it rallied above Tuesday’s highs but was stopped for a slight loss on Thursday when the CAD fell back.
(I was going to write about how I use the COT data in my trading today, but I’ve run out of time. I’ll try to do that next week.)
Quote of the week

On my radar
Given that “everybody” (retail, passive, momentum, trend-following, institutional, etc.) has been a stock buyer, how fragile is the stock market? Who will be a buyer if stocks keep going lower? “Value” investors have not been buying (Buffett has been a substantial net seller.)
The Barney report
Even Barney can see that the Magnificant Seven looks rough around the edges.

Listen to Victor talk markets with Mike Campbell
On this morning’s Moneytalks show, Mike and I discussed the mean reversion trades that have been getting more dynamic, the key turn dates across so many markets, the fact that bad economic news is now bad news for the market and the big swing in the market from late May when expectations were that the Fed would be “higher for longer” to now believing that the Fed will be slashing rates to avoid a recession. You can listen to the whole show here. My 7-minute spot with Mike starts around the 47-minute mark.
Heads up Guys
Regular readers know I keep posting links to Headsupguys because I’ve had too many friends who took their own lives. So many times when that happens, people say, “I would have done something if I’d known he was struggling.”
If you, or someone you know, is down or depressed, reach out to these guys. They can help.

The Archive
Readers can access weekly Trading Desk Notes from the past seven years by clicking the Good Old Stuff-Archive button on the right side of this page.
Subscribe: You have free access to everything on this site. Subscribers receive an email alert when I post something new, usually four to six times a month.
Victor Adair retired from the Canadian brokerage business in 2020 after 44 years and is no longer licensed to provide investment advice. Nothing on this website is investment advice for anyone about anything.


