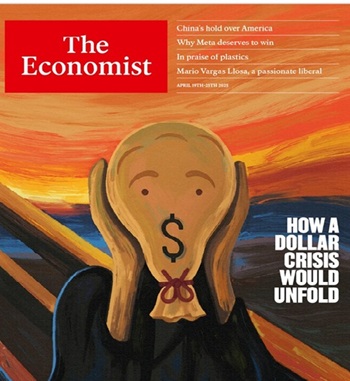
Markets hit “peak uncertainty” on Monday and then reversed dramatically!
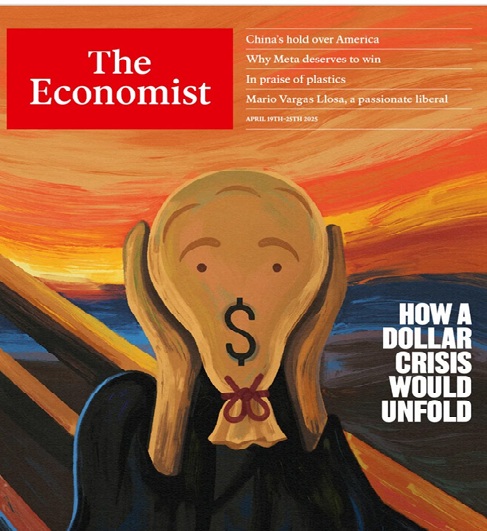
The US Dollar, bonds and stock markets closed near their lows on Monday, while gold closed at all-time highs. Volatility metrics were high, and it was beginning to look like the existential risks surrounding the recent “Sell America” sentiment were producing a “capital flight” away from America.
Then Trump said he “had no intention” of firing Powell, and Bessent said the tariffs against China were “unsustainable.” The USD, stocks and bonds turned on a dime, surged sharply higher overnight, and rallied for the rest of the week.
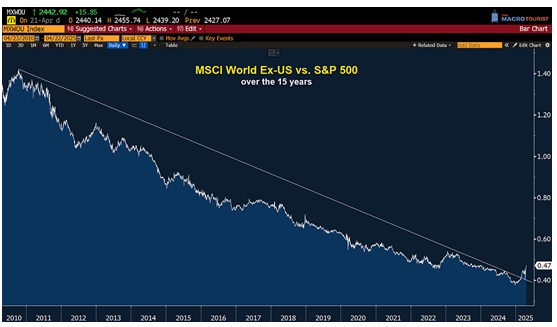
Speaking of “capital flight,” The MSCI World Stock Index Ex the US has soared relative to the S&P since December.
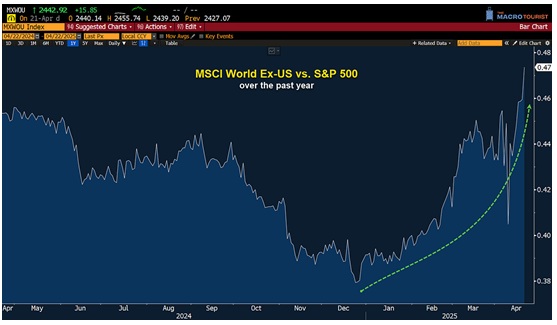
However, from a multi-year perspective, the S&P has blown away the rest of the world. (Kevin Muir produced these two charts and thinks the reversal has a long way to go.)
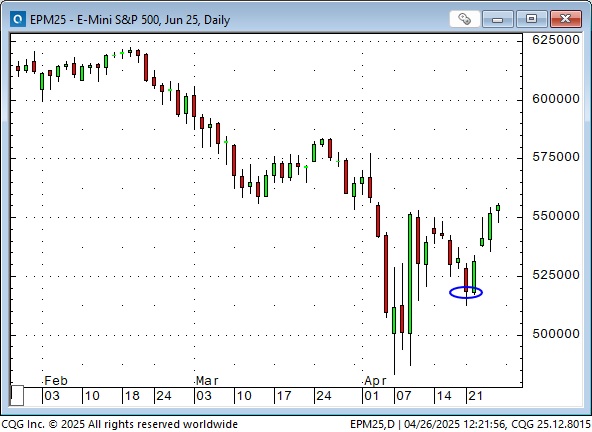
The S&P closed Monday (blue ellipse) down ~18% from February’s all-time highs. It rallied from Tuesday to Friday to close the week down ~11% from February’s highs. On April 7, the S&P was down ~22.5% from the February highs.
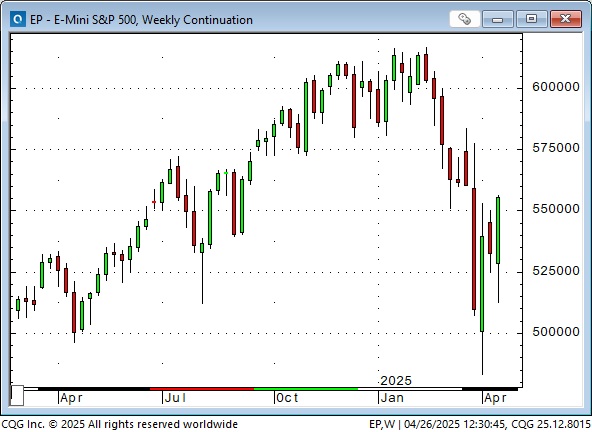
On the weekly chart, the S&P looks set to rally higher.
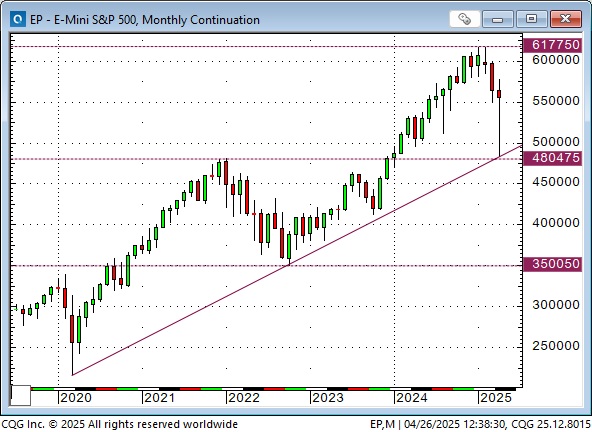
The monthly chart shows that whatever the problem was, it was sorted out quickly, and the multi-year rally can continue! (Sarcasm alert.)
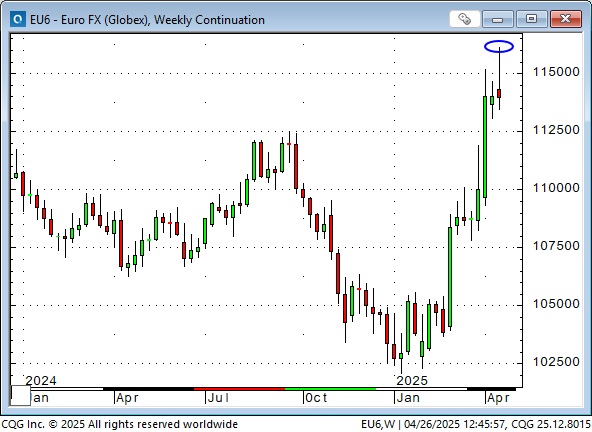
The Euro currency hit 3-year highs on Monday (blue ellipse), up ~14% from January’s lows, but closed red on the week.
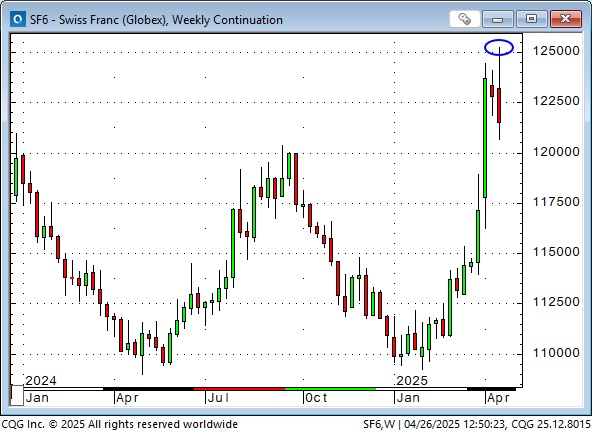
The Swiss Franc (often a harbour for capital flight) hit 14-year highs against the USD (and all-time highs against the Euro) on Monday, but closed red on the week.
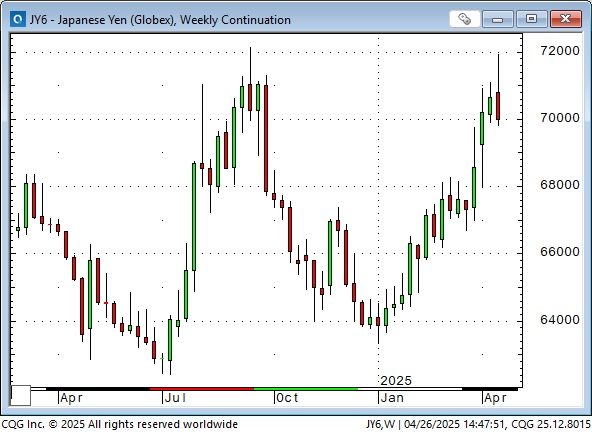
The Japanese Yen surged to 7-month highs in the Monday overnight session, but it turned lower early Tuesday and gapped lower following the Trump/Bessent news. COT data as of April 22 shows that speculative net long positioning has gone from flat in early February to a record high.
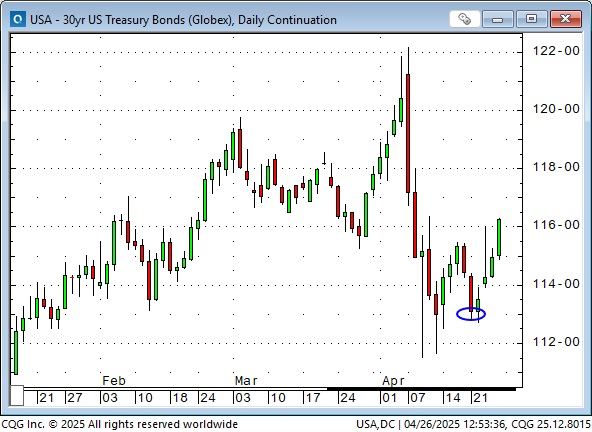
The long bond futures closed near their lows on Monday (blue ellipse), but rallied Tuesday through Friday.
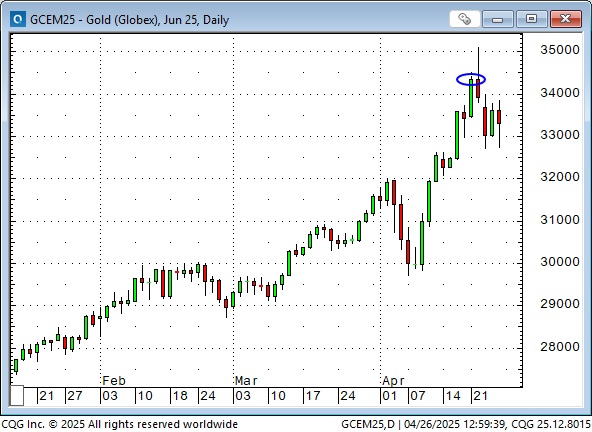
COMEX gold closed at a record high on Monday (blue ellipse) and briefly traded higher overnight (thank you, Shanghai) but then dropped ~$130 from the overnight highs to Tuesday’s lows. At Wednesday’s lows, gold was down ~$240 from Monday’s overnight high. COMEX daily volume on Tuesday’s reversal was the highest YTD.
Speaking of Shanghai:
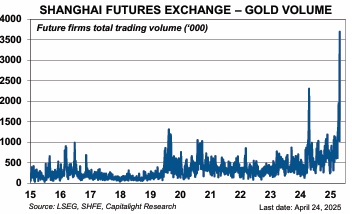
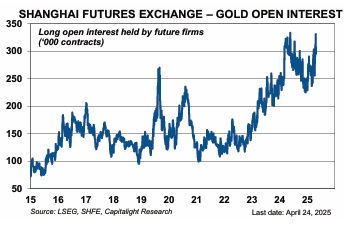
In recent TD Notes, I explained that Comex gold was “tagging along” while Shanghai was the real source of demand (with spot prices frequently higher than New York or London). COT data as of April 22 shows that despite gold prices surging since January, speculative net long positioning on the Comex has steadily declined (down ~42% from January highs) to the lowest levels since March 2024. Comex open interest has also steadily declined since gold broke out to new highs in late January.

The sentiment theme in March and early April was “Sell America” because “American exceptionalism” is over, and Trump is a wrecking ball. During the “Sell America” phase, US assets like stocks, bonds, and the US Dollar fell while foreign assets rallied and/or rose relative to American assets. Gold, uncertainty, and volatility soared. However, the bearish sentiment became too extreme, and a “change in tone” from the Trump administration sparked a swift reversal. See last week’s TD Notes for charts illustrating the extreme bearish sentiment.
Does the reversal have legs?
In January/February, US stock indices and the trade-weighted US Dollar index were at record highs. The US stock market cap was 70% of the world’s total, a record high. Global money managers were hugely overweight US equities, and valuation metrics for US stocks, particularly for big-cap tech, were far higher than valuations in other countries. American assets, in absolute terms and in terms of foreign assets, were overdue for a correction. In a word, Trump’s “capricious” behaviour sparked a correction, and the “reigning in” of that behaviour set up the reversal. Will Trump be less capricious going forward? You decide.
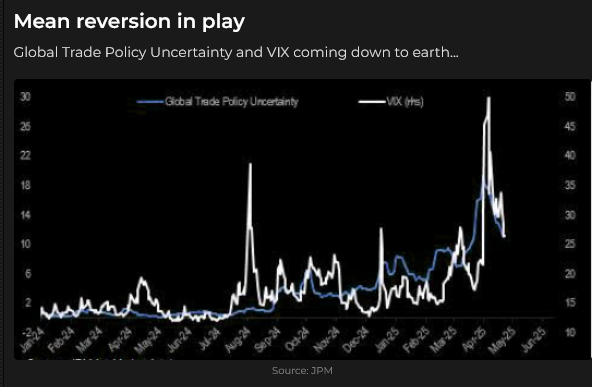
Some of the best short-term stock market rallies occur due to short squeezes in bear markets, and this reversal feels like a short squeeze. It also feels like a “mean reversion” following the extreme sentiment and positioning built up after “Liberation Day.” I don’t think the squeeze is over yet, but it will take a lot more than a short squeeze to take the S&P to new highs.
Volatility is mean-reverting.
I don’t trade with a long-term conviction about where markets will go. Last fall and early this year, I thought US equities were overdue for a correction. Now that they’ve had one, I can equally imagine the stock market making new highs or taking out the April lows. To borrow a term from Nassim Taleb, I think the market is fragile.
My short-term trading
I started this week short the Swiss Franc. My recent “thesis” was that the USD was overdue for a rally, and I had shorted the CAD, the Euro, the Yen and the Swiss. I lost money shorting the other currencies last week but stayed short the Swiss, thinking it was the most overvalued and therefore vulnerable to a reversal. I was stopped for a modest loss in the Sunday overnight session, and the Swiss rallied for another ~100 ticks after my stop was hit. The Swiss weakened on Tuesday, tumbled on the Trump/Bessent news, and continued lower into Friday.
The lesson here is that being “early” is the same as being “wrong.” Last week, I was “early” shorting the Yen and was “wrong.” I can have an opinion about where the market might go, but if the “timing” and location of my entry are wrong, I will probably lose money.
If I had stayed with the short Swiss trade, instead of being stopped out, I would have had a handsome gain following the Trump/Bessent news. Yes, that’s correct, but I had placed my stop at a point where I would be “wrong” to stay short. The Swiss rallied to 14-year highs after hitting my stop. I’m glad I was out.
Fortunately, on Tuesday, I shorted the Euro and the Yen and was nicely ahead on the trades before they fell hard on the Trump/Bessent news. That set up a quandary. Should I “grab the money and run,” or hold? My experience is that when the market gaps in my favour, I should take the money. I did, and the gains more than made up for the losses on the Swiss.
On Thursday, I shorted the Yen again and held that trade into the weekend with a “cushion” of 50 ticks of unrealized gains. If nothing else, I like being short the Yen with speculators holding their largest net long position ever.
Here’s a good reason to be short currencies against the USD:
I did not buy the S&P as markets reversed this week. I saw being short the Yen and the Euro as essentially the “same trade” as being long the S&P.
I shorted the CAD on Monday but covered it for a tiny profit when it started to rally after initially falling on the Trump/Bessent news. Following the news, the CAD was “correlated” with the S&P, not the Euro, so I covered my position.
Thoughts on trading – correlations
A reader asked if I monitor a list of correlations. Here’s my (lightly edited) answer:
I don’t monitor a list of correlations; I look at markets in terms of correlations. Which ones are working, which ones aren’t, and why is that?
For instance, today, is the CAD correlated to the S&P, the Euro, commodities/WTI, the CAD/US interest rate spread, or something else? (If CAD is changing price virtually tick for tick with the S&P and the S&P is aggressively bid, I’d rather buy the CAD than short it.)
I’m particularly interested in when correlations stop working, because that means “something else” has entered the picture. For instance, why did a strong USD and higher US interest rates stop being negatively correlated to gold? What caused the correlation breakdown? (Answer: China started buying gold to such a degree that it overwhelmed previous correlations.)
All markets are correlated, to some degree, with other markets.
If a “group” of highly correlated markets (say soybeans, soybean oil and soybean meal) is in a bullish run, buy the leader, not the laggard. Don’t buy the laggard hoping it will “catch up” to the leader.
Richard Russell used to write a market letter, often referencing whether or not the DJT “confirmed” a move in the DJIA – another example of a working/not working correlation.
Correlations can be “tight” or “loose.” For instance, the forward premium/discount of the CAD to the USD highly correlates with changes in the spread between US and CAD s/t interest rates. (If it gets “out of line,” arbs would bring it back into line.) However, the relationship of WTI crude oil to Brent crude oil is loosely correlated, as is the relationship of gold to silver or gold to crude oil. These are “relative value” correlations and a risk management nightmare!
Brent Donnelly’s calendar for next week

The Barney report
Barney is a happy dog, but he is happiest when running with a big stick in his mouth—the bigger the stick, the better!

Listen to Mike Campbell and me discuss markets
On this morning’s Moneytalks show, Mike and I discussed the 180-degree turn in market sentiment this week. You can listen to the entire show here. My spot with Mike starts around the 1-hour, 10-minute mark. Be sure to listen to Sam Cooper (beginning around the 7-minute mark) exposing alarming details of Chinese Communist Party interference in Canadian politics, organized crime and drug trafficking. Greg Weldon, a veteran trader, talks about the market impact of global geopolitics on gold and Canadian investment opportunities, starting around the 47-minute mark.
The Archive
Readers can access weekly Trading Desk Notes from the past eight years by clicking the Good Old Stuff-Archive button on the right side of this page.
Subscribe: You have free access to everything on this site. Subscribers receive an email alert when I post something new, usually four to six times a month.
Victor Adair retired from the Canadian brokerage business in 2020 after 44 years and is no longer licensed to provide investment advice. Nothing on this website is investment advice for anyone about anything.

